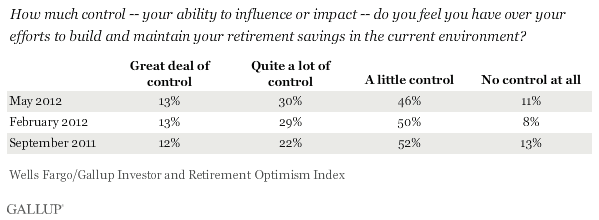
PRINCETON, NJ -- Fifty-seven percent of investors say they feel they have little or no control over their efforts to build and maintain their retirement savings in the current environment. This is essentially the same as the 58% of February, but down from 65% in September 2011, just after the confrontation over the U.S. debt ceiling peaked. Thirty percent say they have quite a lot of control, and 13% say they have a great deal of control.

Separately, 28% of investors say their ability to control their investments has decreased over the past six months. At least six in 10 investors who say this cite unemployment and a weak economy, extreme volatility on Wall Street, a lack of national leadership, and the confrontational political stalemate in the nation's capital as "major factors." Still, investors have grown less likely to name each factor compared with February 2012 and September 2011.

The findings are based on the Wells Fargo/Gallup Investor and Retirement Optimism Index survey, conducted May 4-12, 2012, and quarterly each year. The survey defines investors as those having $10,000 or more of investable assets.
Federal Budget Deficit, Unemployment Hurting the Investment Climate a Lot
Investors point to the federal budget deficit as the most important factor affecting the U.S. investment climate right now, with 70% saying it is hurting the climate "a lot," followed by the unemployment rate at 68%.
Sixty-four percent of investors name a "politically divided federal government" and the price of energy including gas and oil as factors that are hurting the investment climate a lot. About half (48%) say this about the European debt crisis.

Just as Many Say They Are Better Off as Worse Off, Compared With Before 2008 Election
Overall U.S. investor optimism declined to +24 in May, down from +40 recorded in February, according to the poll. The decline was driven by increased investor pessimism about the future course of the overall economy.
Despite the decline in investor optimism, 37% of investors say they are better off financially than they were prior to the last presidential election, while a similar 35% say they are worse off. Investors, on average, are slightly more negative now than they were in February, when 40% said they were better off and 27% said worse off. Still, these perceptions are surprisingly positive when one considers the recent Federal Reserve report indicating that on average, Americans lost 40% of their net worth between 2007 and 2010.

Implications
Even as the May swoon on Wall Street was getting underway and the financial crisis in Europe was becoming more of an issue for the global economy, 57% of investors felt they had little or no control over building and maintaining their retirement savings. Further, 28% said their control over their retirement savings had decreased over the past six months. Little wonder why only 48% of investors in the most recent investor poll say now is a good time to invest in the financial markets, compared with 62% in February of last year.
Given stock and bond market trends of the past several weeks, it is likely that all of these Wells Fargo/Gallup measures have worsened since the survey. The European financial crisis has probably also risen closer to the top of investor worries. Still, despite this lack of control and growing pessimism among investors, about as many investors say they are better off as worse off financially, compared with where they were before the last presidential election.
It is important to note that investors can do something to mitigate their feeling that they lack control over their investment portfolios. They can take the time to develop a financial plan with specific goals, targets, and contingencies. Among investors with a written financial plan having specific goals or targets, the poll shows 80% of nonretirees and 88% of retirees say their plan gives them confidence they can achieve their future financial goals. Quality financial planning is even more important when the investment environment is as chaotic as it has been in recent weeks and months.
Survey Methods
The Wells Fargo/Gallup Investor and Retirement Optimism Index results are based on questions asked on the Gallup Daily tracking survey of a random sample of 1,018 U.S. adults having investable assets of $10,000 or more from May 4-12, 2012. For results based on the entire sample of national adults, one can say with 95% confidence that the maximum margin of sampling error is ±3 percentage points.
For results based on the sample of 609 nonretirees, one can say with 95% confidence that the maximum margin of sampling error is ±4 percentage points. For results based on 420 retirees, one can say with 95% confidence that the maximum margin of sampling error is ±5 percentage points.
Interviews are conducted with respondents on landline telephones and cellular phones, with interviews conducted in Spanish for respondents who are primarily Spanish-speaking. Each sample includes a minimum quota of 400 cell phone respondents and 600 landline respondents per 1,000 national adults, with additional minimum quotas among landline respondents by region. Landline telephone numbers are chosen at random among listed telephone numbers. Cell phone numbers are selected using random-digit-dial methods. Landline respondents are chosen at random within each household on the basis of which member had the most recent birthday.
Samples are weighted by gender, age, race, Hispanic ethnicity, education, region, adults in the household, and phone status (cell phone only/landline only/both, cell phone mostly, and having an unlisted landline number). Demographic weighting targets are based on the March 2011 Current Population Survey figures for the aged 18 and older non-institutionalized population living in U.S. telephone households. All reported margins of sampling error include the computed design effects for weighting and sample design.
In addition to sampling error, question wording and practical difficulties in conducting surveys can introduce error or bias into the findings of public opinion polls.
For more details on Gallup's polling methodology, visit www.gallup.com.
