PRINCETON, NJ -- A majority of U.S. Hispanics identify as political independents (51%) rather than as Democrats (32%) or Republicans (11%). However, once their partisan leanings are taken into account, most Hispanics affiliate with the Democratic Party (52%) rather than the Republican Party (23%). Both sets of numbers shift more decisively in the Democrats' favor among the roughly half of U.S. Hispanics who are registered to vote.
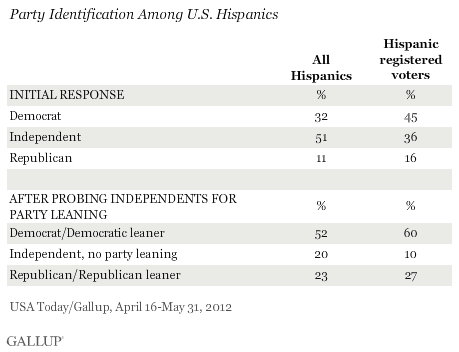
These results are based on a USA Today/Gallup poll of 1,753 Hispanics, conducted April 16-May 31.
They confirm a growing trend toward independent political identification among U.S. Hispanics in recent years, surpassing the 50% mark in 2011, according to annual aggregate data from Gallup Daily tracking. This mirrors the recent trend among all U.S. adults.
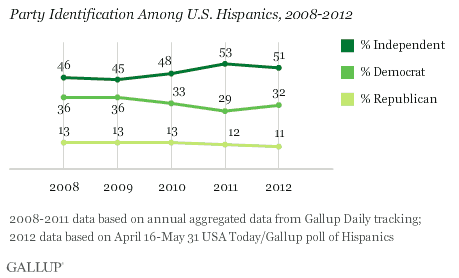
The plurality of U.S. Hispanics have identified as political independents each year since 2008, with about one in three identifying as Democrats and one in eight as Republicans.
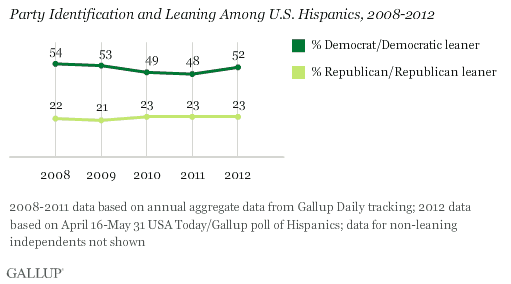
Although a majority of Hispanics identify as political independents, when probed for a party leaning in a follow-up question, roughly twice as many are classified as Democratic identifiers or leaners than as Republican identifiers or leaners.
Immigrants Especially Likely to Be Independent
Hispanic immigrants are much more likely than those born in the United States to lack a political party attachment, contributing to the high proportion of political independence among the U.S. Hispanic population in general.
In addition to measuring their political attitudes, the April 16-May 31 poll of Hispanics asked respondents whether they were born outside the United States and whether their parents were born outside the United States. All told, 49% said they were born outside the United States, 22% were born in this country but one or both of their parents were born outside the United States, and 22% were born in the United States, as were both of their parents.
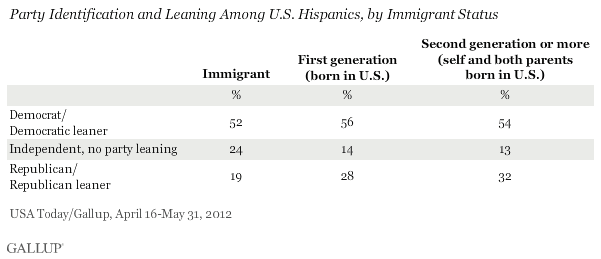
Sixty percent of Hispanic immigrants identify as political independents, compared with 44% of first-generation Hispanic Americans and 43% of second-generation or higher Hispanics. All groups show much greater identification with the Democratic than the Republican Party, though each succeeding generation of Hispanics is more likely to identify as Republican than the prior one.
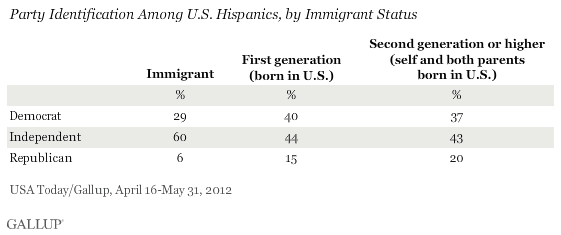
The percentage of Hispanics who identify as Democrats or lean Democratic is fairly consistent across the generations, ranging from 52% to 56%. Hispanics with longer ties to the United States are more likely to be Republicans and less likely to be non-leaning independents.
Implications
Hispanics as a whole are not highly integrated into the U.S. political system, given that only about half are registered to vote and a majority identify as political independents. This is in large part because of the higher detachment from the political process of Hispanic immigrants who make up roughly half of all U.S. Hispanics, but among whom 25% are registered to vote and 60% identify as political independents.
Hispanics of all generations are much more likely to align with the Democratic than the Republican Party, and this preference persists among Hispanics with longer histories in the United States. Republicans do make gains among more established U.S. Hispanics but still trail Democrats by a wide margin among those who have been in the United States for two or more generations.
And Hispanics who are fully integrated into the political process, namely those registered to vote, show even stronger Democratic proclivities.
Thus, while the GOP may make some inroads among Hispanics as they develop deeper American roots in the future, Hispanics are likely to remain a reliable Democratic voting bloc for years to come.
Survey Methods
Results for this USA Today/Gallup poll are based on telephone interviews conducted April 16-May 31, 2012, on the Gallup Daily tracking survey, with a random sample of 1,753 Hispanic adults, aged 18 and older, living in all 50 U.S. states and the District of Columbia.
For results based on the total sample of Hispanics, one can say with 95% confidence that the maximum margin of sampling error is ±3 percentage points.
For results based on the total sample of 1,005 Hispanic registered voters, one can say with 95% confidence that the maximum margin of sampling error is ±4 percentage points.
Interviews are conducted with respondents on landline telephones and cellular phones, with interviews conducted in Spanish for respondents who are primarily Spanish-speaking. Each sample includes a minimum quota of 400 cell phone respondents and 600 landline respondents per 1,000 national adults, with additional minimum quotas among landline respondents by region. Landline telephone numbers are chosen at random among listed telephone numbers. Cell phone numbers are selected using random-digit-dial methods. Landline respondents are chosen at random within each household on the basis of which member had the most recent birthday.
Samples are weighted by gender, age, race, Hispanic ethnicity, education, region, adults in the household, and phone status (cell phone only/landline only/both, cell phone mostly, and having an unlisted landline number). Demographic weighting targets are based on the March 2011 Current Population Survey figures for the aged 18 and older non-institutionalized population living in U.S. telephone households. All reported margins of sampling error include the computed design effects for weighting and sample design.
In addition to sampling error, question wording and practical difficulties in conducting surveys can introduce error or bias into the findings of public opinion polls.
For more details on Gallup's polling methodology, visit www.gallup.com.
