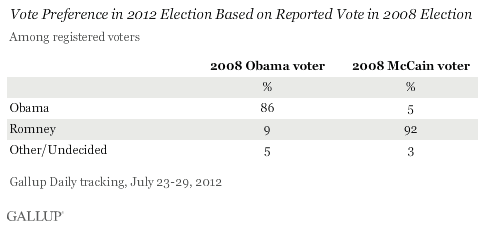
PRINCETON, NJ -- Eighty-six percent of voters who say they voted for Barack Obama in 2008 are backing Obama again this year, a smaller proportion than the 92% of 2008 John McCain voters who are supporting 2012 Republican candidate Mitt Romney. Nine percent of 2008 Obama voters have switched to supporting Romney this year, while 5% of McCain voters have switched to Obama.

The results are based on July 23-29 Gallup Daily tracking with more than 2,000 registered voters who reported voting in the 2008 election. Of these, 48% said they voted for Obama and 42% McCain, with the remaining 10% saying they voted for another candidate or not disclosing their vote choice. However, the six-percentage-point advantage in reported voting for Obama is similar to the actual seven-point edge he had over McCain in the final 2008 returns, 53% to 46%.
Obama and Romney have been tightly matched so far this year, with the two generally tied or one having a slim one- or two-point advantage among registered voters in Gallup Daily tracking.
Thus, it follows that fewer voters are supporting Obama this year than in 2008. But the race remains close because Obama's margin in 2008 was large enough that he could still be tied or in the lead this year if his support is a few percentage points lower.
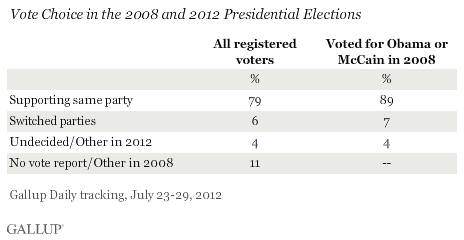
The data do underscore the high degree of party loyalty in voting across the last two elections. All told, 79% of registered voters are supporting the same party's candidate in 2012 as in 2008. That figure understates the true degree of party loyalty because the loyalty of the substantial minority of voters who did not report their 2008 vote choice cannot be computed. Among those who say they voted for either Obama or McCain in 2008, 89% are supporting the same party's candidate in 2012, leaving 11% who are either supporting the other party's candidate (7%) or are undecided (4%).

Nonwhites other than blacks, a group composed largely of Hispanics and Asians, are among the subgroups of 2008 Obama or McCain voters most likely to switch presidential preferences or be undecided this year. Twenty-one percent of this group of voters have a different preference now than in 2008, about double the national average of 11%.
Other groups showing an above-average shift in vote choice between 2008 and 2012 are political independents (18%), political moderates (16%), Eastern residents (15%), those with a high school education or less (15%), and unmarried men (15%).
Implications
The vast majority of U.S. voters are remaining consistent in their voting preferences between 2008 and 2012, be it for Barack Obama or the Republican presidential candidate. But loyalty to Obama is slightly less than loyalty to the Republican candidates, resulting in a more competitive race at this point than in the final 2008 results.
The 11% of 2008 Obama or McCain voters who have switched to supporting the other party's candidate or are undecided at this point is not a relatively large group. But it is a group that could potentially be persuaded between now and Election Day, and thus could be crucial in deciding the outcome.
Track every angle of the presidential race on Gallup.com's Election 2012 page.
Survey Methods
Results are based on telephone interviews conducted as part of Gallup Daily tracking July 23-29, 2012, with a random sample of 2,440 registered voters, aged 18 and older, living in all 50 U.S. states and the District of Columbia, who report voting in the 2008 election.
For results based on the total sample of 2008 voters, one can say with 95% confidence that the maximum margin of sampling error is ±3 percentage points.
For results based on the total sample of 1,149 2008 Obama voters, one can say with 95% confidence that the maximum margin of sampling error is ±4 percentage points.
For results based on the total sample of 1,055 2008 McCain voters, one can say with 95% confidence that the maximum margin of sampling error is ±4 percentage points.
Interviews are conducted with respondents on landline telephones and cellular phones, with interviews conducted in Spanish for respondents who are primarily Spanish-speaking. Each sample includes a minimum quota of 400 cell phone respondents and 600 landline respondents per 1,000 national adults, with additional minimum quotas among landline respondents by region. Landline telephone numbers are chosen at random among listed telephone numbers. Cell phone numbers are selected using random-digit-dial methods. Landline respondents are chosen at random within each household on the basis of which member had the most recent birthday.
Samples are weighted by gender, age, race, Hispanic ethnicity, education, region, adults in the household, and phone status (cell phone only/landline only/both, cell phone mostly, and having an unlisted landline number). Demographic weighting targets are based on the March 2011 Current Population Survey figures for the aged 18 and older non-institutionalized population living in U.S. telephone households. All reported margins of sampling error include the computed design effects for weighting and sample design.
The questions reported here were asked of a random half-sample of respondents for six nights on the Gallup Daily tracking survey.
In addition to sampling error, question wording and practical difficulties in conducting surveys can introduce error or bias into the findings of public opinion polls.
For more details on Gallup's polling methodology, visit www.gallup.com.
