WASHINGTON, D.C. -- Nearly seven in 10 adults in West Virginia, Mississippi, and Kentucky are either overweight or obese -- more than in any other state in the first half of 2012. At the other end of the scale is Colorado, the least overweight state in the union, but even there, 55.1% of residents are overweight or obese.
These findings are from surveys conducted with 177,663 U.S. adults from January through June 2012 for the Gallup-Healthways Well-Being Index, marking a halftime report ahead of full-year 2012 data to be reported early next year. Gallup calculates respondents' Body Mass Index using the standard formula based on their self-reported height and weight.
The World Health Organization defines a normal BMI range as being 18.50 to 24.99. It labels BMIs of 25.00 to less than 30.00 as overweight/pre-obese, and those with BMIs of 30.00 or higher are considered obese.
An average of 62.8% of all American adults were overweight or obese in the first half of 2012 -- 36.3% were overweight and 26.2% were obese, about on par with 2011.
Residents of Southern and Midwestern states are the most likely in the country to be overweight or obese so far in 2012. In fact, nine of the 10 states with the highest overweight/obesity rates in the nation are in the South and Midwest -- with six of these in the South. Those living in Western states and New England are the least likely to be overweight or obese.
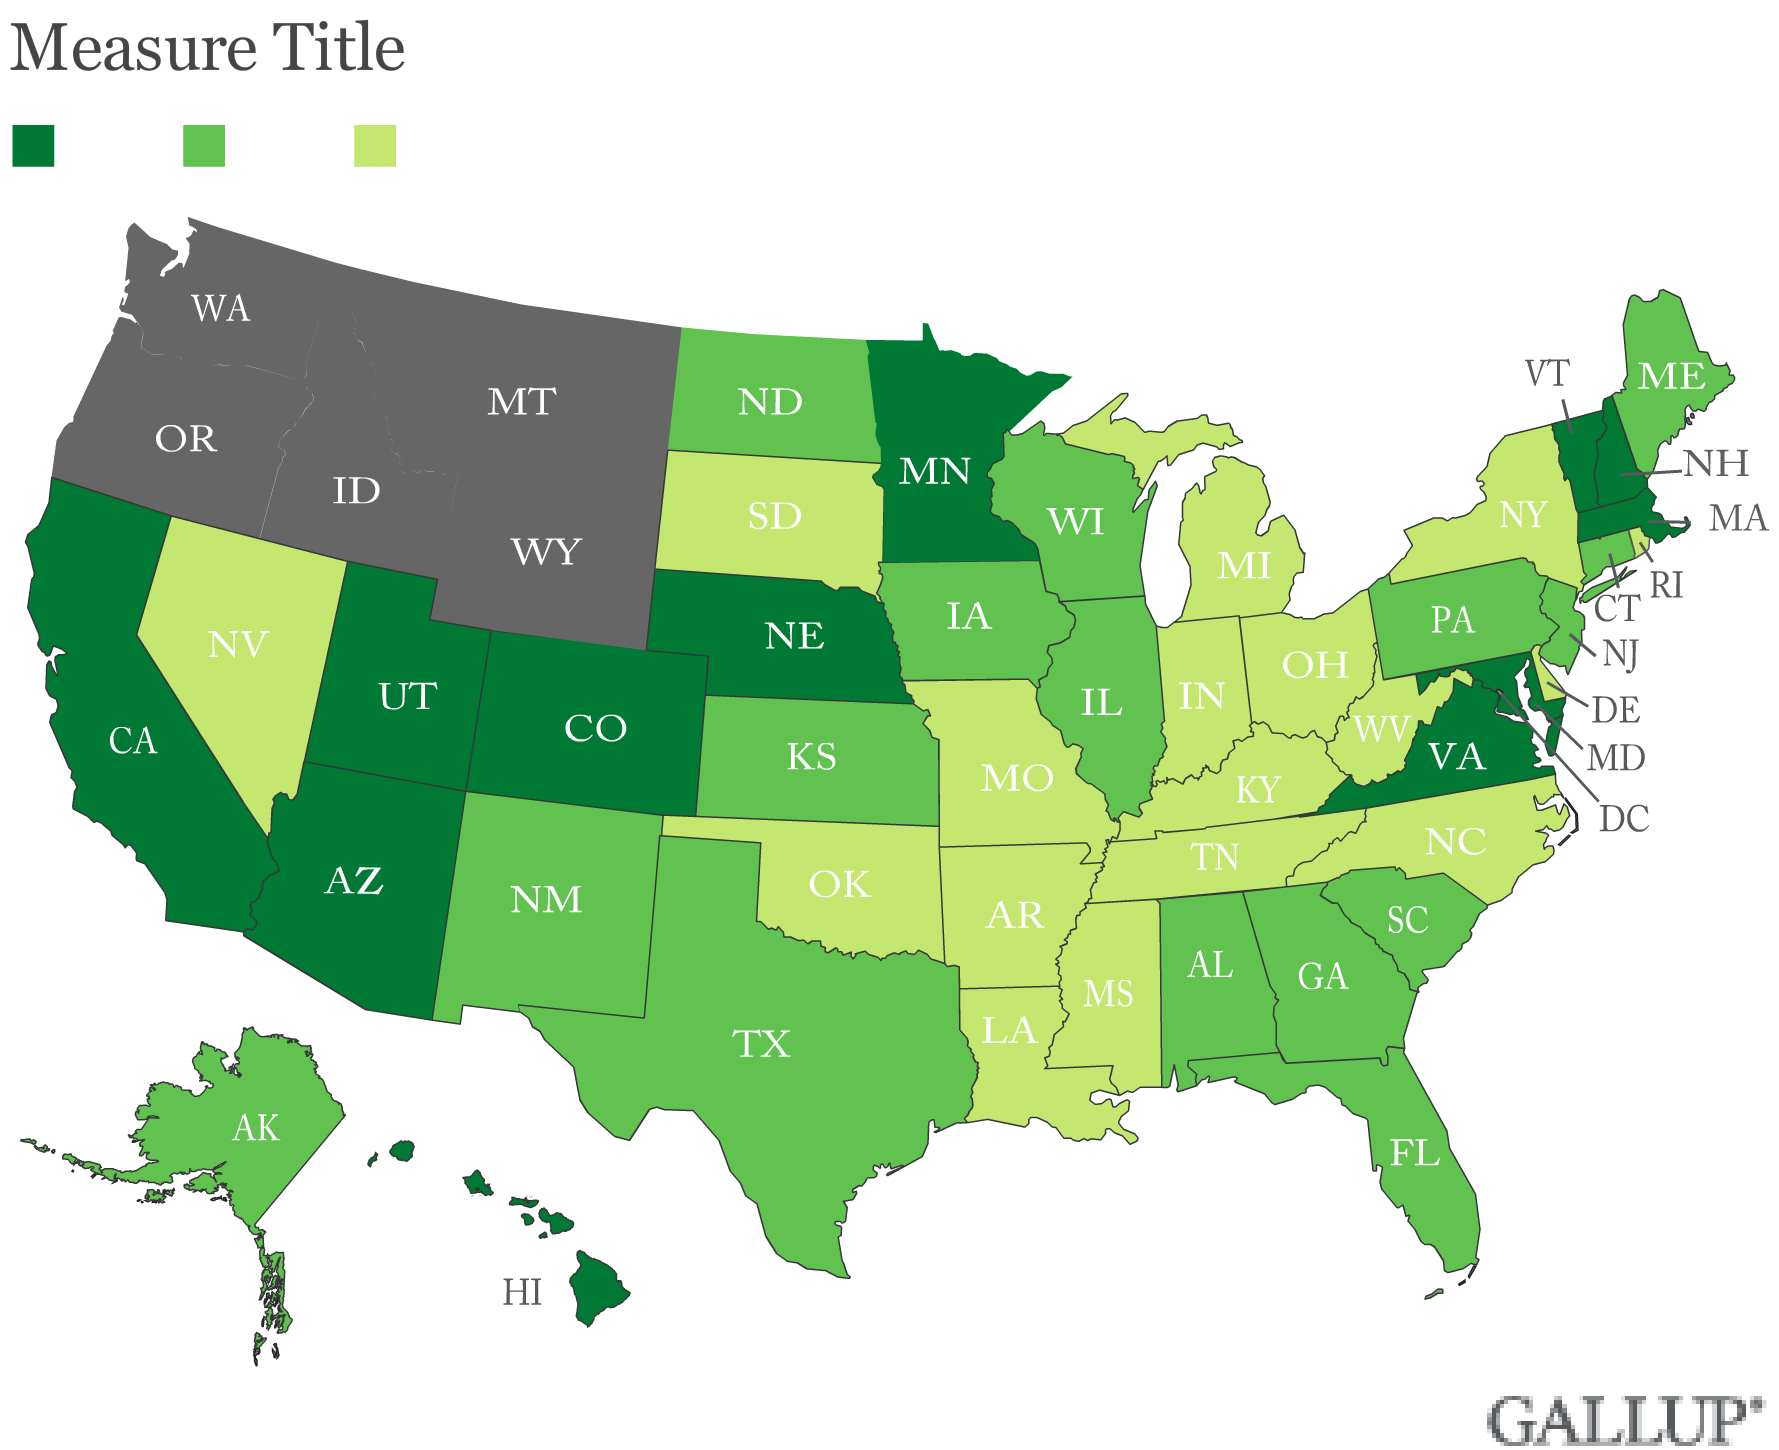
The results for obese and overweight residents by state mirror the patterns in obesity rates alone that Gallup and Healthways have consistently found over the years.
Bottom Line
The majority of the adult population in every U.S. state can be classified as overweight or obese, based on Americans' self-reported height and weight. This means millions of people are at a high risk for developing -- if they haven't already -- costly and deadly chronic illnesses such as diabetes and high blood pressure.
The consequences for states dealing with the very worst rates of being overweight and obese -- where nearly seven in 10 adults fall into one of those categories -- include lower quality of life, greater financial strain, being less attractive to employers, and a higher probability of raising another generation that faces equally serious weight problems. Leaders at all levels must continue to develop new and better ways of addressing the overweight and obesity problem in the United States.
About the Gallup-Healthways Well-Being Index
The Gallup-Healthways Well-Being Index tracks well-being in the U.S., U.K., and Germany and provides best-in-class solutions for a healthier world. To learn more, please visit well-beingindex.com.
Survey Methods
Results are based on telephone interviews conducted as part of Gallup Daily tracking/the Gallup Healthways Well-Being Index survey January through June 2012, with a random sample of 177,663 adults, aged 18 and older, living in all 50 U.S. states and the District of Columbia.
For results based on the total sample of national adults, one can say with 95% confidence that the maximum margin of sampling error is ±0.3 percentage points.
The margin of sampling error for most states is ±1 to ±2 percentage points, but is as high as ±4 points for smaller states such as Wyoming, North Dakota, South Dakota, Delaware, and Hawaii.
Interviews are conducted with respondents on landline telephones and cellular phones, with interviews conducted in Spanish for respondents who are primarily Spanish-speaking. Each sample includes a minimum quota of 400 cell phone respondents and 600 landline respondents per 1,000 national adults, with additional minimum quotas among landline respondents by region. Landline telephone numbers are chosen at random among listed telephone numbers. Cell phone numbers are selected using random-digit-dial methods. Landline respondents are chosen at random within each household on the basis of which member had the most recent birthday.
Samples are weighted by gender, age, race, Hispanic ethnicity, education, region, adults in the household, and phone status (cell phone only/landline only/both, cell phone mostly, and having an unlisted landline number). Demographic weighting targets are based on the March 2011 Current Population Survey figures for the aged 18 and older non-institutionalized population living in U.S. telephone households. All reported margins of sampling error include the computed design effects for weighting and sample design.
In addition to sampling error, question wording and practical difficulties in conducting surveys can introduce error or bias into the findings of public opinion polls.
For more details on Gallup's polling methodology, visit www.gallup.com.