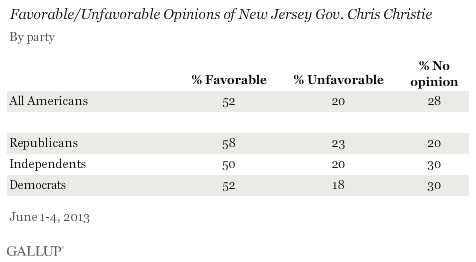
PRINCETON, NJ -- New Jersey Gov. Chris Christie, a rising star in the Republican constellation and possible presidential contender in 2016, has a remarkable and unusually similar appeal to Democrats and independents as well as to Republicans nationally, with half or more of each group saying they have a favorable opinion of him.

Christie is in the news this week as a result of his actions after the death of New Jersey Democratic Sen. Frank Lautenberg. Christie called a special election in October to fill Lautenberg's seat, angering some Republicans who thought he should have appointed a Republican to hold the seat until 2014, rather than holding an election.
The June 1-4 data were collected largely before that story hit the news, but Christie's 58% favorable rating among Republicans nationwide underscores his positive image among that group. Christie's 52% favorable rating among Democrats testifies to his cross-partisan appeal at this point, as does his 50% favorable rating among independents. Typically, partisan politicians are rated positively by supporters of their party and negatively by supporters of the other party.
One slightly negative note comes from his 23% unfavorable rating among Republicans, marginally higher than his negatives among Democrats or independents. This may reflect that Republicans are paying close attention to Christie's overall political positioning, and some in the party may be displeased with Christie's high-visibility public appearances with President Barack Obama in the aftermath of Hurricane Sandy at the New Jersey shore, including one just before last November's presidential election.
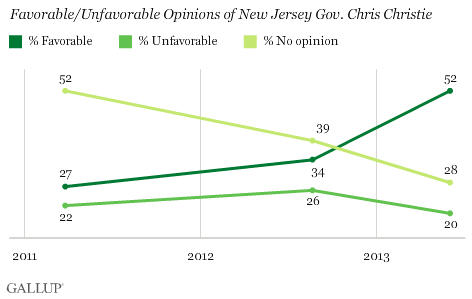
Christie's name identification is 72% today, up from the 49% of Americans who knew enough about him to have an opinion in March 2011. Over that time, his favorable ratings have almost doubled, while his unfavorable ratings have dropped by two percentage points.

Implications
Gov. Christie is up for re-election this November, and all current polling in New Jersey shows him with a wide margin over his Democratic opponent, leading some observers to conclude that his margin of victory in the race will be most important for his possible 2016 presidential bid, not the mere fact that he wins.
New Jersey is a blue state, and went for Obama over Romney last November by a 17-point margin, 58% to 41%. Thus, the fact that Christie was elected governor there in 2009, and that several months before this fall's election, he looks like a strong favorite to win again provide testimony that he has the same cross-party appeal locally that he enjoys nationally. Whether Christie can maintain this positive image over the next three years is a key question that could have significant bearing on the shape of the 2016 presidential election.
Survey Methods
Results for this Gallup poll are based on telephone interviews conducted June 1-4, 2013, with a random sample of 1,529 adults, aged 18 and older, living in all 50 U.S. states and the District of Columbia.
For results based on the total sample of national adults, one can say with 95% confidence that the margin of sampling error is ±3 percentage points.
Interviews are conducted with respondents on landline telephones and cellular phones, with interviews conducted in Spanish for respondents who are primarily Spanish-speaking. Each sample of national adults includes a minimum quota of 50% cellphone respondents and 50% landline respondents, with additional minimum quotas by region. Landline telephone numbers are chosen at random among listed telephone numbers. Cellphone numbers are selected using random digit dial methods. Landline respondents are chosen at random within each household on the basis of which member had the most recent birthday.
Samples are weighted to correct for unequal selection probability, nonresponse, and double coverage of landline and cell users in the two sampling frames. They are also weighted to match the national demographics of gender, age, race, Hispanic ethnicity, education, region, population density, and phone status (cellphone only/landline only/both, cellphone mostly, and having an unlisted landline number). Demographic weighting targets are based on the March 2012 Current Population Survey figures for the aged 18 and older U.S. population. Phone status targets are based on the July-December 2011 National Health Interview Survey. Population density targets are based on the 2010 census. All reported margins of sampling error include the computed design effects for weighting.
In addition to sampling error, question wording and practical difficulties in conducting surveys can introduce error or bias into the findings of public opinion polls.
View methodology, full question results, and trend data.
For more details on Gallup's polling methodology, visit www.gallup.com.
