PRINCETON, NJ -- Of five recent Republican newsmakers also mentioned as potential 2016 presidential candidates, Wisconsin Rep. and 2012 vice presidential nominee Paul Ryan is rated most positively by Republicans and Republican-leaning independents, with a 69% favorable rating and +57 net favorable score. Florida Sen. Marco Rubio is also relatively popular among the Republican rank-and-file, while Chris Christie is less so, given his higher unfavorable rating.

The results are based on a June 1-4 Gallup poll, which tested the images of five Republicans who could run for president in the next election. These include two Hispanic Republican U.S. senators -- Rubio and Texas Sen. Ted Cruz -- a Tea Party and libertarian favorite in Kentucky Sen. Rand Paul, outspoken New Jersey Gov. Christie, and Ryan, the House Budget committee chairman who was Mitt Romney's 2012 running mate.
Most Republicans are familiar with Ryan, Christie, Rubio, and Paul, with at least seven in 10 having an opinion of each. Cruz, just elected to the Senate last November, is familiar to about half of Republicans.
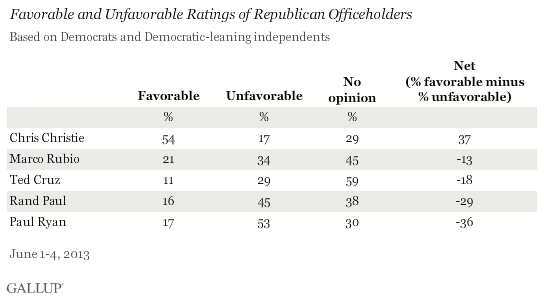
The Republican officeholders' relative standing among Republicans is not mirrored among Democrats or the larger general population. Ryan, who has the most positive net favorable score among Republicans, has the worst net score among Democrats and Democratic-leaning independents. That could be a result of his presence on the 2012 GOP ticket, making him more of a partisan figure. Christie, by contrast, is more liked than disliked by Democrats, and is the only one of the five with a net positive image among Democrats.

In fact, Christie's net favorable is higher among Democrats (+37) than it is among Republicans (+28). Christie has become much better known in recent months, likely due to his response to Superstorm Sandy. That response has included public appearances alongside President Barack Obama.
Each of the Republican officeholders is less familiar to Democrats than to Republicans. Ryan and Christie are best known among Democrats, with at least 70% having an opinion of them.
The net favorable scores for all five Republicans are in positive territory among all Americans. That is because rank-and-file Republicans are more familiar with, and generally much more positive toward, the five GOP officeholders than are Democrats.
Christie, with net positive ratings among both party groups, has the highest score among all Americans, with Rubio second. Ryan's high negatives from Democrats leave him with a +8 net favorable rating among all Americans, although that is a bit better than the +2 and +3 scores Gallup measured for him during the 2012 campaign.

Implications
The five Republican officeholders currently appear to meet two minimum factors for a successful presidential campaign: they are generally well-liked by the Republican rank-and-file, and are more liked than disliked by the larger general population.
Christie and Ryan present interesting contrasts, though. Ryan's high favorability among Republicans but lower favorability among the general public would position him to do well in the Republican primaries, but perhaps make him a less formidable general election candidate. Christie, on the other hand, would appear to be a stronger general election than Republican primary candidate, given his lower favorability among Republicans but higher favorability among Democrats and Americans more generally.
Of course, it is more than just basic likability that determines whether a candidate has success in a primary election process. Rudy Giuliani was very popular prior to the 2008 primaries but fared poorly in the actual voting. Meanwhile, Mitt Romney was not as well-liked but emerged as the winner of the 2012 Republican nomination process.
And opinions about politicians often change once politicians officially become candidates, and throughout the campaign in response to primary results and other events that occur on the campaign trail.
The five Republican officials tested here are at least a year away from announcing a formal decision about whether to run for president, and certainly it is a far from comprehensive list of all Republicans who could run. But the poll does give a sense of some of the more visible possible contenders' relative popularity at this point in time, within their own party and among the broader population.
Survey Methods
Results for this Gallup poll are based on telephone interviews conducted June 1-4, 2013, with a random sample of 1,529 adults, aged 18 and older, living in all 50 U.S. states and the District of Columbia.
For results based on the total sample of national adults, one can say with 95% confidence that the margin of sampling error is ±3 percentage points.
For results based on the total sample of 703 Republicans and Republican leaning independents, one can say with 95% confidence that the margin of sampling error is ±5 percentage points.
For results based on the total sample of 663 Democrats and Democratic leaning independents, one can say with 95% confidence that the margin of sampling error is ±5 percentage points.
Interviews are conducted with respondents on landline telephones and cellular phones, with interviews conducted in Spanish for respondents who are primarily Spanish-speaking. Each sample of national adults includes a minimum quota of 50% cellphone respondents and 50% landline respondents, with additional minimum quotas by region. Landline telephone numbers are chosen at random among listed telephone numbers. Cellphone numbers are selected using random digit dial methods. Landline respondents are chosen at random within each household on the basis of which member had the most recent birthday.
Samples are weighted to correct for unequal selection probability, nonresponse, and double coverage of landline and cell users in the two sampling frames. They are also weighted to match the national demographics of gender, age, race, Hispanic ethnicity, education, region, population density, and phone status (cellphone only/landline only/both, cellphone mostly, and having an unlisted landline number). Demographic weighting targets are based on the March 2012 Current Population Survey figures for the aged 18 and older U.S. population. Phone status targets are based on the July-December 2011 National Health Interview Survey. Population density targets are based on the 2010 census. All reported margins of sampling error include the computed design effects for weighting.
In addition to sampling error, question wording and practical difficulties in conducting surveys can introduce error or bias into the findings of public opinion polls.
View methodology, full question results, and trend data.
For more details on Gallup's polling methodology, visit www.gallup.com.
