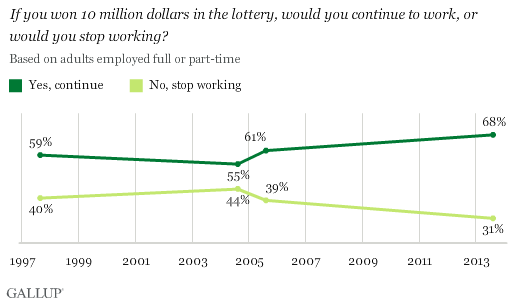
PRINCETON, NJ -- Two-thirds of American workers say they would continue working even if they won $10 million in the lottery, while 31% say they would stop. This desire to keep working after enjoying a financial windfall is higher today than in three earlier Gallup measures, all prior to the 2008-2009 recession.

These data are from Gallup's Aug. 7-11 Work and Education survey. In each of the three previous times Gallup asked this lottery question, the percentage saying they would quit after winning $10 million ranged from 39% to 44%.
This value American workers appear to place on working clearly plays out in reality, as some winners of the recent $448 multistate Powerball lottery did indeed decide to keep working. Susan Nickel, 63 years old, was one of the winners in New Jersey, but told reporters that while she would urge her husband to retire, she, personally, would continue working. On the other hand, winner Paul White of Minnesota was representative of the minority of workers across the country, saying he didn't "want to work for anybody else for the rest of my life for a paycheck."
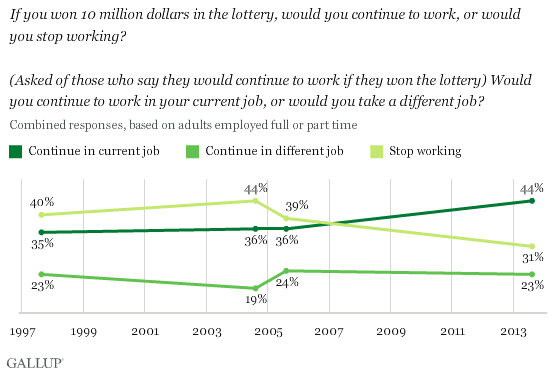
Most American workers who predict they would continue working even after winning the lottery say they would want to stay at the same job rather than seek a new job. The roughly 2-to-1 ratio in favor of keeping the same job versus getting a new one is about the same as in 2004, but slightly higher than in 2005 and 1997.

Young Workers Most Likely to Keep Job, but More Willing to Switch Employers
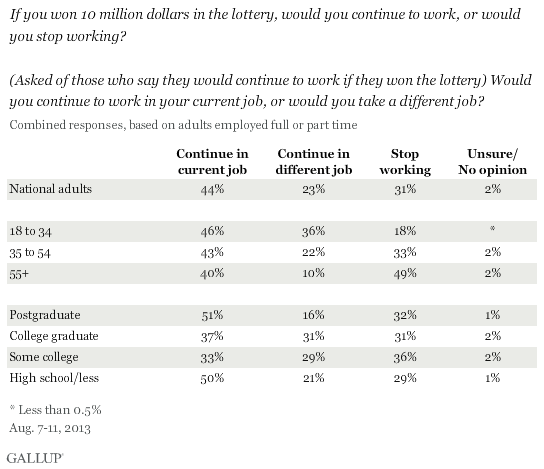
Workers aged 55 and older are much more likely than young workers to say they would quit if they won a $10 million lottery prize. Additionally, older workers who would keep working are much more likely to say they would continue in their current job rather than seek a new job, while those who are younger are more divided. In short, the choice for the large majority of older workers who win the lottery would be to either maintain the same job or quit altogether, while the choice among younger workers would be much more focused on keeping the same job or taking a different job.

There is relatively little variation in desire to quit working across educational categories. However, those with postgraduate education or with a high school diploma or less are the most likely to want to stay in their current job, while the middle education groups -- college graduates and those with some college -- are more likely on a relative basis to say they would continue working, but in a different job.
Implications
Apparently, most American workers find work rewarding enough, either financially or in other ways, to compel them to continue working even if they were to win $10 million in the lottery. More feel this way today than did so when Gallup asked this question from 1997 through 2005.
It is not clear what has caused this change. The population as a whole has aged since 1997, as those in the huge baby boomer generation have moved toward the end of their working years. But because the data show that older workers are the most likely to say they would quit their job if they won the lottery, the aging of the population over the last 16 years does not appear to have been a factor in the change in sentiment about continuing to work after winning the lottery.
The 2008 recession intervened between the 2005 and 2013 surveys, and it may be that workers today have a renewed appreciation for the value of having a job -- even if they were to become independently wealthy.
It is also possible that the perceived value of winning $10 million may be less now than in past iterations of the survey as detailed facts about lottery winnings become better known. Given that most big prizes are distributed over multiple years or are reduced if taken as a lump sum, and are heavily taxed, some workers may simply think they still would need to work in order to meet their financial goals, even after winning that amount. It's also possible that inflation has lessened the perceived value of $10 million.
Finally, the increase in workers' desire to keep on the job after winning a lottery may also reflect an increase in workers' sense of the self-identity and non-financial rewards they gain from their employment.
Survey Methods
Results for this Gallup poll are based on telephone interviews conducted Aug. 7-11, 2013, with a random sample of 1,039 adults who are employed full or part time, aged 18 and older, living in all 50 U.S. states and the District of Columbia.
For results based on the total sample of working adults, one can say with 95% confidence that the margin of sampling error is ±3 percentage points.
Interviews are conducted with respondents on landline telephones and cellular phones, with interviews conducted in Spanish for respondents who are primarily Spanish-speaking. Each sample of national adults includes a minimum quota of 50% cellphone respondents and 50% landline respondents, with additional minimum quotas by region. Landline and cell telephone numbers are selected using random-digit-dial methods. Landline respondents are chosen at random within each household on the basis of which member had the most recent birthday.
Samples are weighted to correct for unequal selection probability, nonresponse, and double coverage of landline and cell users in the two sampling frames. They are also weighted to match the national demographics of gender, age, race, Hispanic ethnicity, education, region, population density, and phone status (cellphone only/landline only/both, and cellphone mostly). Demographic weighting targets are based on the March 2012 Current Population Survey figures for the aged 18 and older U.S. population. Phone status targets are based on the July-December 2011 National Health Interview Survey. Population density targets are based on the 2010 census. All reported margins of sampling error include the computed design effects for weighting.
In addition to sampling error, question wording and practical difficulties in conducting surveys can introduce error or bias into the findings of public opinion polls.
View methodology, full question results, and trend data.
For more details on Gallup's polling methodology, visit www.gallup.com.
