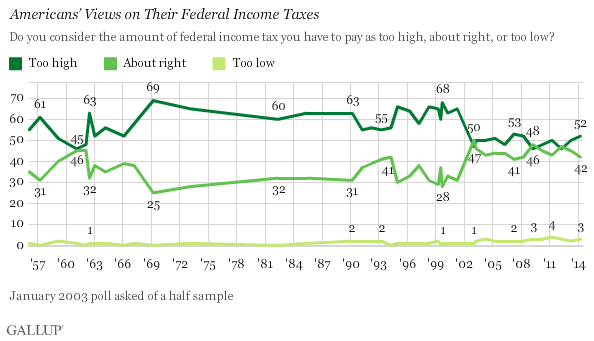
WASHINGTON, D.C. -- As many Americans scramble to prepare their taxes ahead of the April 15 deadline, a majority, 52%, say the amount they have to pay in federal income tax is "too high," while 42% say it is "about right." The percentage who say their taxes are too high has hovered around 50% since 2003, although the current 52% is up from 46% two years ago.

Americans' current views of the amount they pay in taxes represent a significant change from prior to 2003, when they were much more likely to say their taxes were too high. The lower percentage since 2003 who say their taxes are too high most likely reflects the effect of the 2001 and 2003 income tax cuts passed during George W. Bush's administration. Prior to Bush's presidency, as many as 69% of Americans felt their taxes were too high, while as little as a quarter felt they were about right.
Few Americans have ever described their taxes as being "too low," with at most 4% saying this in the nearly 60 years Gallup has asked the question.
Americans' views on their federal taxes are similar to their views of their state taxes. A recent Gallup 50-state survey found that 50% of residents across all states, on average, believe their state taxes are too high.
A Slight Majority of Americans Say Their Taxes Are Fair
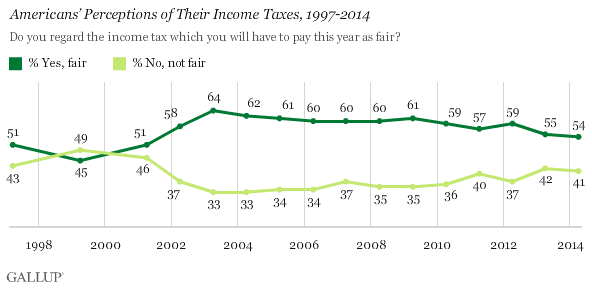
While a slim majority of Americans say their federal tax burden is too high, roughly the same percentage also say their taxes are fair. However, the view that taxes are fair is becoming less common, and, at 54% this year, is down to its lowest point since 2001 -- after peaking at 64% in 2003.

The majority of Americans have not always felt their taxes were fair. In 1999, slightly more Americans said their taxes were not fair (49%) than fair (45%). But this was the only year in which Americans were more likely to say their taxes were unfair.
Gallup also asked this question in the 1940s, mostly during World War II. During the war, Americans were overwhelmingly likely to say their taxes were fair, most likely out of a sense of patriotism as the nation was spending a large percentage of citizens' tax money to fight the war.
Americans' perceptions of their taxes being fair peaked in February 1944 at 90%. In 1946, after the war had concluded, the percentage regarding their taxes as fair dropped to 60%.
Democrats More Likely Than Republicans to See Taxes as Fair
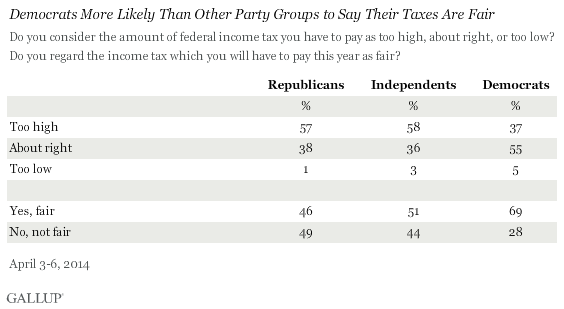
Democrats are the only partisan group in which a majority, 55%, say their taxes are "about right." A majority of Republicans and independents say their taxes are "too high." Furthermore, Democrats (69%) are significantly more likely than Republicans (46%) and independents (51%) to say their taxes are fair.

These patterns are largely consistent with what Gallup found last year. However, the pattern has changed from prior to Barack Obama's presidency, when Americans across partisan groups felt similarly about whether their taxes were too high. In 2006, for example, 47% of Republicans and 47% of Democrats reported their taxes were too high, while 50% of independents said the same.
Views of tax fairness did reflect partisan differences in 2006. While the majority of Democrats, 56%, reported their taxes were fair, this was less than the percentage of Republicans who said this at the time. The percentage of Democrats who say their taxes are fair in 2014 is higher than the percentage who did in 2006. Republicans, at 65% fair, were much more likely to view their taxes as fair in 2006 than they are today. In 2006, 60% of independents felt their taxes were fair.
Upper-Income Americans Least Likely to Say Taxes Are Fair
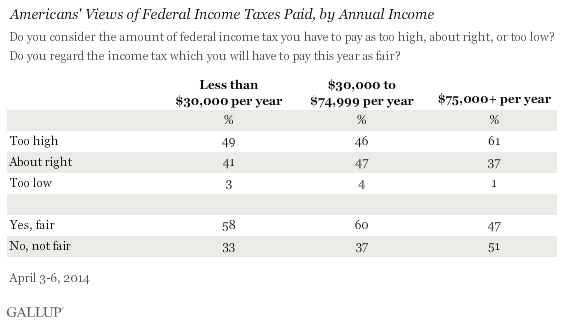
Six in 10 upper-income Americans -- those earning $75,000 or more annually -- believe their taxes are too high, and the majority consider what they pay unfair. By contrast, barely half of middle- and lower-income Americans think their taxes are too high, and the majority consider them fair.

Implications
As Americans across the country file their taxes, they either celebrate receiving a refund or dread how much they owe. This year, 52% of Americans feel they pay too much, the highest since before the height of the Great Recession in October 2008. However, it remains lower than what Gallup found from the 1960s through the 1990s.
The slight increase this year in Americans' views that their taxes are too high may reflect an actual increase in taxes, either direct or indirect, that has occurred recently. Specifically, the expiration of the Bush tax cuts increased taxes and eliminated some previous deductions. Upper-income Americans, particularly, may feel their taxes are too high now because their taxes actually may have increased. The uptick also may reflect overall discontent with the federal government, Congress, and high-profile laws such as the Affordable Care Act.
As political leaders discuss ways to simplify the tax code, the federal government also may want to revisit the amount of money Americans pay in taxes.
Survey Methods
Results for this Gallup poll are based on telephone interviews conducted April 3-6, 2014, on the Gallup Daily tracking survey, with a random sample of 1,026 adults, aged 18 and older, living in all 50 U.S. states and the District of Columbia.
For results based on the total sample of national adults, the margin of sampling error is ±4 percentage points at the 95% confidence level.
Interviews are conducted with respondents on landline telephones and cellular phones, with interviews conducted in Spanish for respondents who are primarily Spanish-speaking. Each sample of national adults includes a minimum quota of 50% cellphone respondents and 50% landline respondents, with additional minimum quotas by time zone within region. Landline and cellular telephone numbers are selected using random-digit-dial methods. Landline respondents are chosen at random within each household on the basis of which member had the most recent birthday.
Samples are weighted to correct for unequal selection probability, nonresponse, and double coverage of landline and cell users in the two sampling frames. They are also weighted to match the national demographics of gender, age, race, Hispanic ethnicity, education, region, population density, and phone status (cellphone only/landline only/both, and cellphone mostly). Demographic weighting targets are based on the most recent Current Population Survey figures for the aged 18 and older U.S. population. Phone status targets are based on the most recent National Health Interview Survey. Population density targets are based on the most recent U.S. census. All reported margins of sampling error include the computed design effects for weighting.
In addition to sampling error, question wording and practical difficulties in conducting surveys can introduce error or bias into the findings of public opinion polls.
For more details on Gallup's polling methodology, visit www.gallup.com.
