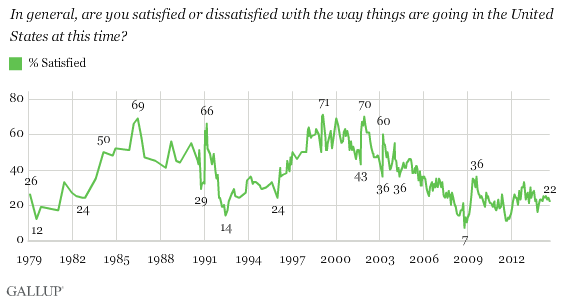
PRINCETON, NJ -- Twenty-two percent of Americans are satisfied and 76% are dissatisfied with the way things are going in the U.S. at this time. Americans' satisfaction has been quite stable this year, ranging narrowly between 22% and 25%.

The last time a majority of Americans were satisfied with the direction of the country was more than a decade ago, a 55% reading in January 2004. Further, satisfaction has not topped 40% since July 2005, amid a struggling economy, wars in Iraq and Afghanistan, and declining confidence in government. This period also saw satisfaction sink to an all-time low of 7% in October 2008, shortly after the financial crisis hit.
While satisfaction is higher today than back then, it has only exceeded 30% for two brief stretches since 2008 -- from May through August 2009 shortly after President Barack Obama took office, and in November 2012 when he was re-elected to a second term.
Historically, Gallup has found partisan differences in satisfaction ratings, usually tied to the party of the president. Consistent with this pattern, currently 37% of Democrats are satisfied, compared with 19% of independents and 10% of Republicans.
Low Satisfaction Predicts Larger Seat Change in Midterm Election
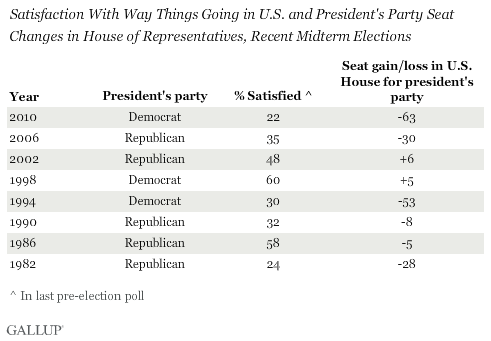
Americans' level of satisfaction with the way things are going in the country has historically been related to midterm election outcomes. Generally speaking, the lower the level of satisfaction, the more seats the president's party loses in the House of Representatives.
Since 1982, the first year Gallup asked satisfaction in a midterm election year, between 22% (in 2010) and 60% (in 1998) of Americans have been satisfied with the way things were going at the time of the midterm election. Unless things change significantly over the next two months, satisfaction this year will be among the lowest Gallup has measured in a midterm election, along with the 2010 reading and a 24% reading in 1982.

In the three midterm election years in which satisfaction has been higher than 40%, the president's party gained seats in two (1998 and 2002) and lost a relatively small five seats in the other (1986).
When satisfaction has been below 40%, the president's party has lost an average of 36 seats, ranging from a low of eight in 1990 to a high of 63 in 2010. The relatively minimal seat loss for George H.W. Bush's Republican Party in 1990, when 26% were satisfied with national conditions, was due to his relatively solid job approval rating of 58% at the time of that year's midterm.
In other years when satisfaction was low, the president's approval rating also tended to be low. Obama's approval rating has been in the low 40% range this summer.
Even though the political conditions favor large seat losses for the Democrats, there are some structural factors in place this year that may lead to smaller losses. The first is Republicans already have a healthy majority won in the 2010 midterms that was largely maintained in 2012. With redistricting reducing the number of competitive congressional districts, Republicans may already be near the maximum number of seats they could reasonably expect to hold.
Also, even though the president is unpopular and Americans are dissatisfied with the state of the nation, they do view the Democratic Party more positively than the Republican Party.
Implications
With Americans mostly dissatisfied with the state of the country and most disapproving of the job President Obama is doing, the Democratic Party is going into the fall midterm in a very unfavorable political environment. Given that the president's party almost always loses seats in Congress, the real uncertainty in the 2014 elections is not whether Democrats will lose seats in the House, but how many they will lose.
Although the pattern is not as reliable as in the House, the president's party also typically loses seats in the Senate in midterm elections. Democratic incumbents elected in a strong Democratic environment in 2008 are especially vulnerable as they seek re-election this year in a much less favorable political climate.
There is little to suggest based on history that the national political environment could change in the Democrats' favor in the roughly two-and-a-half months before the election. Historically, Americans' satisfaction with the way things are going in the country and presidential job approval do not improve much over the course of a midterm election year.
Survey Methods
Results for this Gallup poll are based on telephone interviews conducted Aug. 7-10, 2014, with a random sample of 1,032 adults, aged 18 and older, living in all 50 U.S. states and the District of Columbia.
For results based on the total sample of national adults, the margin of sampling error is ±4 percentage points at the 95% confidence level.
Interviews are conducted with respondents on landline telephones and cellular phones, with interviews conducted in Spanish for respondents who are primarily Spanish-speaking. Each sample of national adults includes a minimum quota of 50% cellphone respondents and 50% landline respondents, with additional minimum quotas by time zone within region. Landline and cellular telephone numbers are selected using random-digit-dial methods. Landline respondents are chosen at random within each household on the basis of which member had the most recent birthday.
Samples are weighted to correct for unequal selection probability, nonresponse, and double coverage of landline and cell users in the two sampling frames. They are also weighted to match the national demographics of gender, age, race, Hispanic ethnicity, education, region, population density, and phone status (cellphone only/landline only/both, and cellphone mostly). Demographic weighting targets are based on the most recent Current Population Survey figures for the aged 18 and older U.S. population. Phone status targets are based on the most recent National Health Interview Survey. Population density targets are based on the most recent U.S. census. All reported margins of sampling error include the computed design effects for weighting.
In addition to sampling error, question wording and practical difficulties in conducting surveys can introduce error or bias into the findings of public opinion polls.
View survey methodology, complete question responses, and trends.
For more details on Gallup's polling methodology, visit www.gallup.com.
