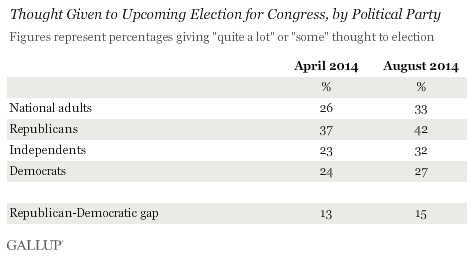
PRINCETON, NJ -- One in three Americans (33%) say they have given "quite a lot" or "some" thought to the 2014 midterm election, up from 26% in April. Importantly, Republicans (42%) are much more engaged than Democrats (27%) in the election at this point.

Just as Americans' thought given to the election has increased from April, it should continue to increase between now and Election Day, as has been the case in prior midterm election years. Although Gallup does not have much historical data on this question prior to the fall months, there is some evidence suggesting Americans' attention to this year's election is lower than in 2006 and 2010. In June 2006 (41%) and June 2010 (37%), more Americans said they had given at least some thought to the election than say so now.
The question about the thought Americans are giving to the election is one that Gallup uses to identify those Americans most inclined to vote in a coming election. Consistent with their usually higher voter turnout, typically more Republicans than Democrats say they have given thought to the election.
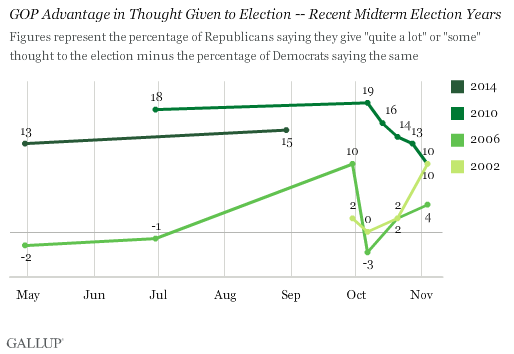
The gaps in election thought by party can change throughout the course of an election. There was no consistent pattern in how Republican versus Democratic thought changed leading up to Election Day in the past three midterm election years.
- The 10-percentage-point GOP advantage just prior to the 2010 election was actually a bit smaller than Gallup had measured earlier in the fall, peaking at 19 points in early October and averaging 14 points during the fall months.
- There were relatively small differences in Republican versus Democratic thought in 2006, apart from a higher GOP advantage in mid-September that vanished quickly. The GOP held a slight four-point advantage by the end of the campaign in what was a Democratic "wave" election.
- In 2002, the parties were basically even through much of the fall campaign, before Republicans surged at the end -- perhaps due to the intense campaigning of then-popular President George W. Bush on behalf of Republican candidates.

Overall, the changes in the election thought gap by party in the final months before previous elections suggest that the gap in late summer or early fall is by no means what will be in place on Election Day. If there is no significant narrowing of the Republican-Democratic thought gap between now and Election Day, the Republican advantage in turnout could surpass that on Election Day 2010.
One difference, though, is that registered voters were more likely to say they were going to vote for Republican candidates in 2010 than they are now. In Gallup's final 2010 pre-election poll, Republicans led Democrats by 48% to 44% among all registered voters in their vote intention for the House of Representatives. In the recent Aug. 7-10 poll, Democrats held a slight edge among registered voters in congressional voting preference, 47% to 45%. So even if Republican turnout is as strong or stronger this year than in 2010, that may not mean Republican candidates will do as well as they did four years ago.
Implications
Democrats need strong turnout to minimize the potential seat losses in Congress that occur in nearly every midterm election for the president's party. But with Republicans much more engaged in the election at this point than Democrats -- and by one of the larger margins in recent midterm election years -- the odds of strong Democratic turnout seem low, suggesting 2014 could be a good year for Republicans. Even if the Republican advantage narrows considerably by Election Day, as seen in 2010, Republicans seem poised to have the upper hand in turnout.
To some degree, the Democratic deficit in election thought may reflect not just their turnout intentions but also their beliefs about the likelihood their party will perform well in the election. From that standpoint, the measure may overstate the Republican advantage in potential turnout this year. Even if that is the case, it is clear Democrats are operating at a deficit in voter motivation that looks more like recent strong Republican midterm years in 2002 and 2010 than the strong Democratic one in 2006.
Survey Methods
Results for this Gallup poll are based on telephone interviews conducted Aug. 7-10, 2014, with a random sample of 1,032 adults, aged 18 and older, living in all 50 U.S. states and the District of Columbia.
For results based on the total sample of national adults, the margin of sampling error is ±4 percentage points at the 95% confidence level.
For results based on the total sample of 897 registered voters, the margin of sampling error is ±4 percentage points at the 95% confidence level.
Interviews are conducted with respondents on landline telephones and cellular phones, with interviews conducted in Spanish for respondents who are primarily Spanish-speaking. Each sample of national adults includes a minimum quota of 50% cellphone respondents and 50% landline respondents, with additional minimum quotas by time zone within region. Landline and cellular telephone numbers are selected using random-digit-dial methods. Landline respondents are chosen at random within each household on the basis of which member had the most recent birthday.
Samples are weighted to correct for unequal selection probability, nonresponse, and double coverage of landline and cell users in the two sampling frames. They are also weighted to match the national demographics of gender, age, race, Hispanic ethnicity, education, region, population density, and phone status (cellphone only/landline only/both, and cellphone mostly). Demographic weighting targets are based on the most recent Current Population Survey figures for the aged 18 and older U.S. population. Phone status targets are based on the most recent National Health Interview Survey. Population density targets are based on the most recent U.S. census. All reported margins of sampling error include the computed design effects for weighting.
In addition to sampling error, question wording and practical difficulties in conducting surveys can introduce error or bias into the findings of public opinion polls.
View survey methodology, complete question responses, and trends.
For more details on Gallup's polling methodology, visit www.gallup.com.
