WASHINGTON, D.C. -- More than one in four Americans are satisfied with the way the nation is being governed, while nearly three in four are dissatisfied. Americans' satisfaction has varied widely in recent years. Although the 27% who are currently satisfied is higher than the record-low satisfaction seen last October during the partial government shutdown, it is still below where it was in September 2013, before the shutdown began.
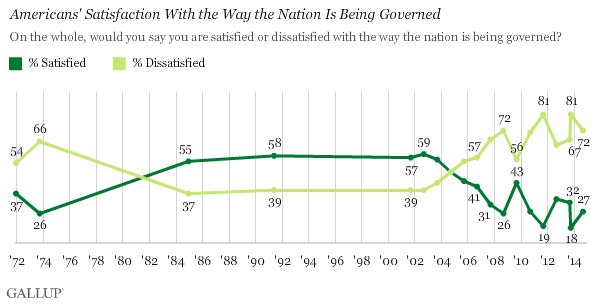
Gallup first asked Americans about their satisfaction with the way the country is governed in 1971 and has done so at least annually since 2001. Prior to 2008, the record low was 26% in 1973, during the Watergate scandal. In two measurements in the 1980s and 1990s, and from 2001 until 2003, more Americans were satisfied with the government than were dissatisfied.
However, in 2004, Americans were evenly divided, and more have been dissatisfied than satisfied since then. Satisfaction has been a highly fluid measure, reaching as high as 43% in 2009 before plummeting below 20% in 2011 and in late 2013, both years in which Congress faced heated budget discussions.
Satisfaction Hasn't Returned to Pre-Shutdown Levels Among Democrats
The month before the partial shutdown, more than half of Democrats (54%) were satisfied with the way the U.S. was governed. This dropped to 28% in October 2013, and now has partially recovered to 46%. Republicans and independents are as likely to be satisfied today as they were in September 2013, although satisfaction among both groups is much lower than among Democrats.
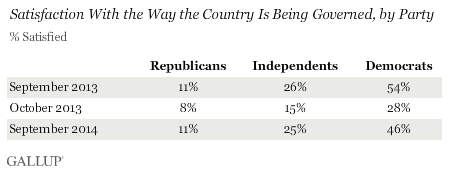
During the last year, about one in 10 Republicans have been satisfied with the way the country is governed. Republicans' satisfaction had the smallest drop during the partial government shutdown, mainly because it was already so low.
Historically, Americans who affiliate with the president's political party are more likely than others to be satisfied with the way the nation is being governed. In 2007, when George W. Bush was president, six in 10 Republicans were satisfied, compared with 18% of Democrats and independents. In 2009, after President Barack Obama took office, 72% of Democrats were satisfied with the way the nation was governed, but Republican satisfaction had fallen to 16% and independents were in the middle at 34%.
Bottom Line
The partial government shutdown affected Americans' views of many things, including a sharp drop in economic confidence and a rise in the percentage saying dysfunctional government was the most important problem in the country. While views on a number of these issues have improved since the shutdown ended, many Americans continue to have low opinions of the country's government. Currently, Americans are not satisfied with the way things are going in the country and are less trusting of the executive and legislative branches than they were in 2013. With voters set to go to the polls in a little more than a month, incumbents seeking re-election may face a more challenging fight than in the past.
Survey Methods
Results for this Gallup poll are based on telephone interviews conducted Sept. 4-7, 2014, with a random sample of 1,017 adults, aged 18 and older, living in all 50 U.S. states and the District of Columbia.
For results based on the total sample of national adults, the margin of sampling error is ±4 percentage points at the 95% confidence level.
Interviews are conducted with respondents on landline telephones and cellular phones, with interviews conducted in Spanish for respondents who are primarily Spanish-speaking. Each sample of national adults includes a minimum quota of 50% cellphone respondents and 50% landline respondents, with additional minimum quotas by time zone within region. Landline and cellular telephone numbers are selected using random-digit-dial methods. Landline respondents are chosen at random within each household on the basis of which member had the most recent birthday.
Samples are weighted to correct for unequal selection probability, nonresponse, and double coverage of landline and cell users in the two sampling frames. They are also weighted to match the national demographics of gender, age, race, Hispanic ethnicity, education, region, population density, and phone status (cellphone only/landline only/both, and cellphone mostly). Demographic weighting targets are based on the most recent Current Population Survey figures for the aged 18 and older U.S. population. Phone status targets are based on the most recent National Health Interview Survey. Population density targets are based on the most recent U.S. census. All reported margins of sampling error include the computed design effects for weighting.
In addition to sampling error, question wording and practical difficulties in conducting surveys can introduce error or bias into the findings of public opinion polls.
View survey methodology, complete question responses, and trends.
For more details on Gallup's polling methodology, visit www.gallup.com.
