Story Highlights
- Highest reading since June 2013
- Economic outlook score climbs six points to a new high for 2014
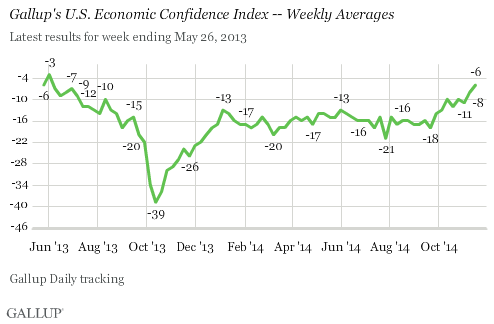
WASHINGTON, D.C. -- The U.S. Economic Confidence Index reached -6 for the week ending Nov. 16 -- its highest score since June 2013. This is up two points from the previous week, and furthers a series of incremental improvements seen since late September.

The most recent weekly index score of -6 is just three points off the -3 registered in June 2013, the highest Gallup has found since it began tracking economic confidence daily in January 2008.
Gallup's Economic Confidence Index is the average of two components: Americans' views of current economic conditions and whether they think the economy will get better or will get worse. The index has a theoretical maximum of +100 -- if all Americans rated current conditions as excellent or good and thought the economy was getting better -- and a theoretical minimum of -100, if all Americans rated current conditions as poor and thought the economy was getting worse.
Thus, even with the recent improvement, Americans are still more likely to view the economy negatively than positively overall.
For the week ending Nov. 16, 24% of Americans described the economy as "excellent" or "good," while 31% said it was "poor." This results in a current conditions score of -7 -- down slightly from the previous week's -5.
Americans' outlook on the economy, meanwhile, reached its highest mark in 2014 so far and the best since last June. Forty-six percent of Americans said the economy was getting better while 50% said it was getting worse, resulting in an economic outlook score of -4. This is a six-point increase from the previous week.

Bottom Line
The improvements in Americans' ratings of the national economy in recent weeks suggest that Gallup's Economic Confidence Index could soon escape negative territory for the first time since the recession.
This higher confidence could translate into a promising upward trend for retailers as the holiday season approaches.
Survey Methods
Results for this Gallup poll are based on telephone interviews conducted Nov. 10-16, 2014, on the Gallup U.S. Daily survey, with a random sample of 3,550 adults, aged 18 and older, living in all 50 U.S. states and the District of Columbia. For results based on the total sample of national adults, the margin of sampling error is ±2 percentage points at the 95% confidence level.
Each sample of national adults includes a minimum quota of 50% cellphone respondents and 50% landline respondents, with additional minimum quotas by time zone within region. Landline and cellular telephone numbers are selected using random-digit-dial methods.
Learn more about how the Gallup U.S. Daily works.

