Story Highlights
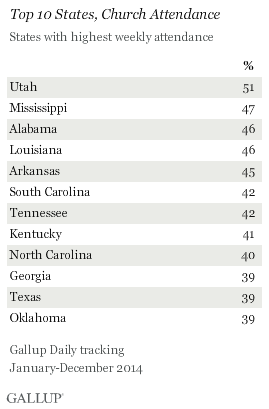
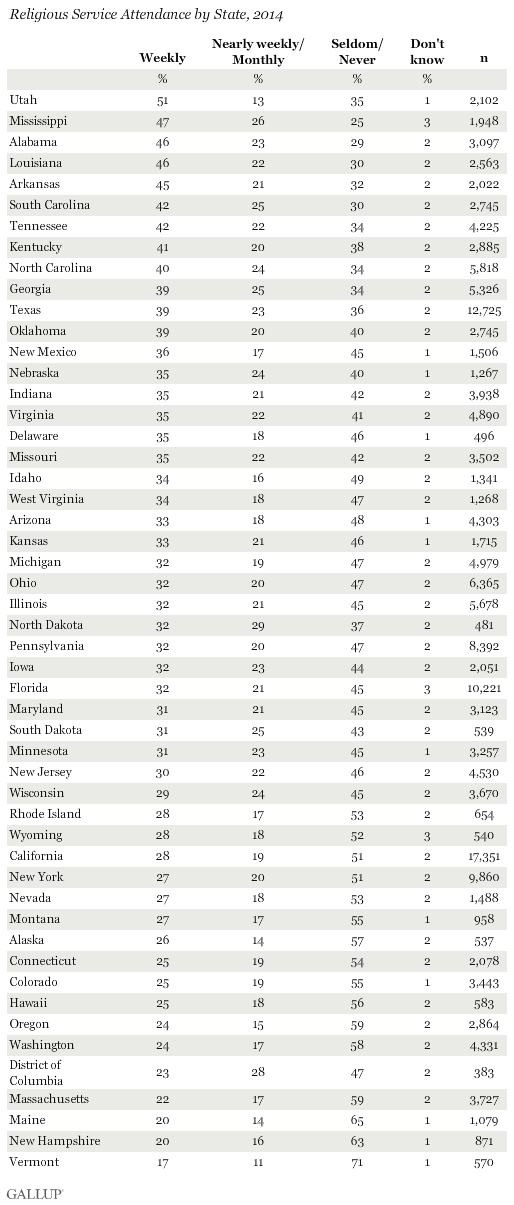
- 51% of Utah residents attend church weekly, highest in U.S.
- Otherwise, highest states on this measure are mostly in South
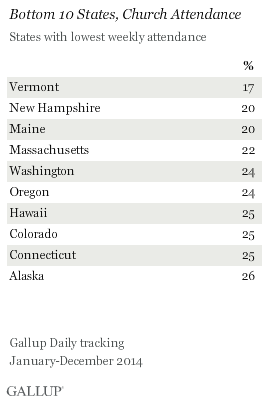
- Lowest weekly attendance found in New England states
This story is part of Gallup's annual "State of the States" series, which reveals state-by-state differences on political, economic, religion and well-being measures.
PRINCETON, N.J. -- Slightly more than half of Utah residents say they attend religious services every week, more than any other state in the union. Residents in the four Southern states of Mississippi, Alabama, Louisiana and Arkansas are the next most likely to be frequent church attendees, with 45% to 47% reporting weekly attendance. At the other end of the spectrum is Vermont, where 17% of residents say they attend religious services every week.
These results are based on Gallup Daily tracking interviews throughout 2014 with 177,030 U.S. adults, and reflect those who say "at least once a week" when asked, "How often do you attend church, synagogue or mosque -- at least once a week, almost every week, about once a month, seldom or never?" Church attendance self-reports are estimates, and may not reflect precise week in and week out attendance, but provide an important measure of the way in which Americans view their personal, underlying religiosity. In particular, the focus on the top category of "weekly" attendance yields a good indicator of the percentage of each state's population that is highly religious, and for whom religion is likely to be a significant factor in their daily lives.
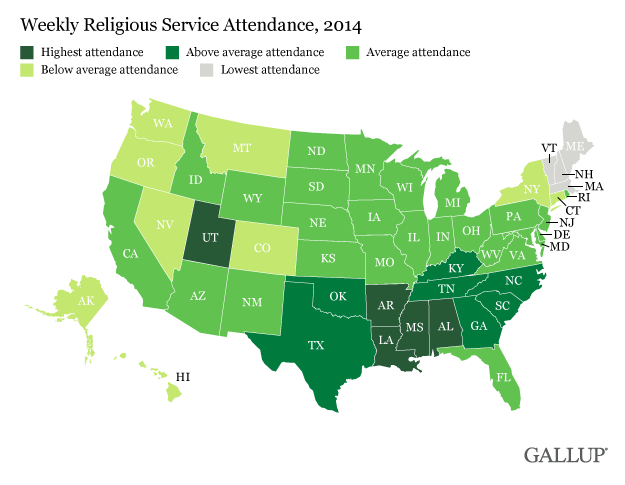
Ten of the 12 states with the highest self-reported religious service attendance are in the South, along with Utah and Oklahoma. The strong religious culture in the South reflects a variety of factors, including history, cultural norms and the fact that these states have high Protestant and black populations -- both of which are above average in their self-reported religious service attendance. Utah's No. 1 position on the list is a direct result of that state's 59% Mormon population, as Mormons have the highest religious service attendance of any major religious group in the U.S.
Five of the six New England states rank among the bottom 10 states for church attendance. Of these, Vermont, New Hampshire, Maine and Massachusetts have the lowest average attendance rates in the nation, with Connecticut not far behind. All other states in the bottom 10 are in the West, including the nation's three states that are as far as one can go in the northwest corner of the country -- Alaska, Washington and Oregon. States with average religious service attendance tend to cluster in the middle of the country.
Implications
In his recent National Prayer Breakfast speech in Washington, D.C., President Barack Obama noted, "The United States is one of the most religious countries in the world -- far more religious than most Western developed countries." This is certainly true as far as the nation's average religiosity is concerned, but the fact remains that within the U.S. there are stark geographic differences in religiosity. In some states of the union -- Utah and Southern states -- roughly half of residents report attending religious services weekly, while in others -- mostly in the Northeast and the West -- a fourth or less of residents attend weekly.
The state-by-state variations in church attendance are significant because attendance is a powerful indicator of underlying religiosity, which in turn is related to Americans' views on life, culture, society in general and politics. For most segments of U.S. society -- blacks being the exception -- those who are the most religious are also most likely to be Republican, which helps explain the significant relationship between states with the highest church attendance and those that are traditionally red states. Church attendance also provides ties that bind members to their communities, and research shows that at the individual level, those who are most religious have higher well-being than those who are less religious.
There is no definitive answer as to why residents in a state like Mississippi are so likely to be in church on Sundays, while residents in a state like Vermont are so unlikely. Some of the differences reflect the types of people who choose to live in these states, and some reflect the types of religion that are predominant in a given state. A good deal is related to the history, culture and norms that are found in a particular state. Whatever the underlying reasons, it is clear that the cultural practice of attendance at religious services is much more dominant in specific states and regions of the U.S. than it is in others.
Survey Methods
Results for this Gallup poll are based on telephone interviews conducted Jan. 2-Dec. 30, 2014, on the Gallup Daily tracking survey, with a random sample of 177,030 adults, aged 18 and older, living in all 50 U.S. states and the District of Columbia.
For results based on the total sample of national adults, the margin of sampling error is ±1 percentage point at the 95% confidence level.
Margins of error for individual states are no greater than ±6 percentage points, and are ±3 percentage points in most states. All reported margins of sampling error include the computed design effects for weighting.
Interviews are conducted with respondents on landline telephones and cellular phones, with interviews conducted in Spanish for respondents who are primarily Spanish-speaking. Each sample of national adults includes a minimum quota of 50% cellphone respondents and 50% landline respondents, with additional minimum quotas by time zone within region. Landline and cellular telephone numbers are selected using random-digit-dial methods. Landline respondents are chosen at random within each household on the basis of which member had the most recent birthday.
Samples are weighted to correct for unequal selection probability, nonresponse and double coverage of landline and cell users in the two sampling frames. National samples are weighted to match the national demographics of gender, age, race, Hispanic ethnicity, education, region, population density and phone status (cellphone only/landline only/both, cellphone mostly and having an unlisted landline number). Demographic weighting targets are based on the most recent Current Population Survey figures for the aged 18 and older U.S. population. Phone status targets are based on the most recent National Health Interview Survey. Population density targets are based on the most recent U.S. census. State samples are weighted to match state demographics of gender, age, race, Hispanic ethnicity and region. State demographic weighting targets are based on the most recent Nielsen Claritas data set.
Learn more about how the Gallup U.S. Daily works.
