Story Highlights
- Nonreligious more supportive of nontraditional candidates
- Catholics tend to be more supportive than Protestants
- Socialist, atheist candidates spark biggest religious support gaps
PRINCETON, N.J. -- Despite tidal shifts over the past 60 years in Americans' willingness to support a well-qualified black, female, Catholic or Jewish candidate for president to the point that these are now widely accepted, significant segments of Americans still don't endorse candidates who are gay or lesbian, evangelical Christian, Muslim, atheist or socialist. No more than three in four Americans say they would vote for candidates from any of these backgrounds. However, that support differs sharply by Americans' religious affiliation.
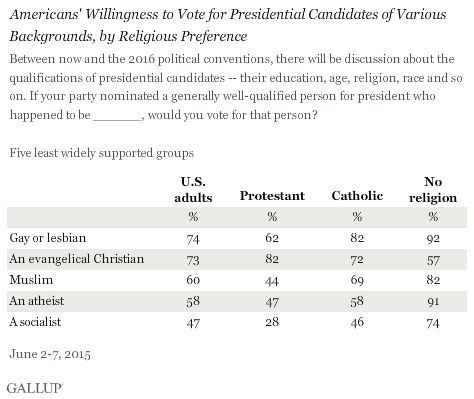
Currently, 74% of Americans as a whole say they would support a well-qualified candidate for their party's presidential nomination who happened to be gay or lesbian, up from 55% only eight years ago. But this varies from nearly universal acceptance (92%) among adults who profess no religion -- including self-identified atheists, agnostics, and those with no specific religious preference -- and 82% among Catholics to 62% among Protestants.
Similarly, atheists enjoy broad acceptance from those who don't identify with any religion, 91% of whom say they would support an atheist for president. However, this drops to 47% among Protestants, and is not much higher among Catholics (58%). As a result, the overall percentage who would vote for an atheist stands at 58%.
Americans with no religious preference (57%) are far less likely than Protestants (82%) or Catholics (72%) to say they would vote for an evangelical Christian who is otherwise well qualified. Yet 82% of the nonreligious would back a Muslim, significantly higher than the percentage of Catholics (69%) and Protestants (44%) who would. Evangelicals wind up ahead of Muslims in acceptability to the public, 73% vs. 60%, but both groups significantly trail Catholics (93%) and Jews (91%) in this regard.
Socialists provoke the widest religious gap, with 74% of the nonreligious being open to supporting a well-qualified socialist, compared with 46% of Catholics and 28% of Protestants. As a result, less than half of Americans -- 47% -- are willing to entertain the idea of supporting a socialist for president, the only group falling below this threshold.
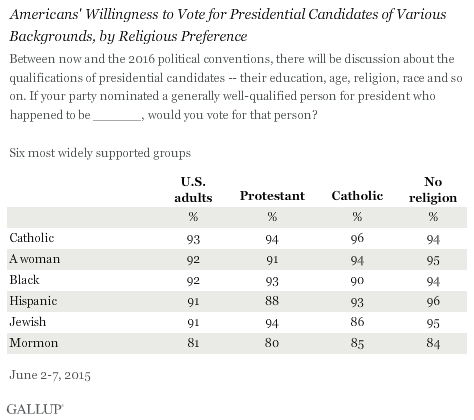
These deep religious divisions stand in contrast to the unity seen among Protestants, Catholics and the nonreligious when it comes to voting for Catholics, women, blacks, Hispanics, Jews and Mormons -- all groups that have achieved broad public acceptance on this measure.
The results by frequency of religious attendance largely mirror those by religious preference. Americans who attend their church or other place of worship weekly or nearly weekly hold views similar to those of Protestants, while those who seldom or never attend look like those with no religious affiliation. However, the nonreligious are still significantly more accepting of most of the nontraditional candidates reviewed here than even infrequent church attendees are.
Similarly, in line with the political orientation of the three religious categories reviewed here, Protestants' views about the candidate types tend to be similar to political conservatives', Catholics look most similar to moderates, and the nonreligious are more in line with liberals.
Implications
President John F. Kennedy in 1960 was the first Catholic elected as U.S. president, at a time when 71% of Americans said they would be willing to back a candidate of his faith. That same year, the chances of a black or female candidate winning were nil, with barely half of Americans open to supporting either. Since then, willingness to support a black or female candidate has swelled to more than 90%, and both groups have significantly increased their numbers in elected office, even if not the presidency. Americans have also become more willing to support Hispanics, Jews and, to a lesser degree, Mormons.
While public acceptance of presidential candidates representing these categories is now uniformly high across societal groups, including by religion, the same cannot be said for candidates from what might be termed micro-minority groups. Reluctance among Christians, particularly Protestants, to support gays and lesbians, atheists, Muslims and socialists means presidential candidates with these characteristics could meet with significant resistance. And while President Jimmy Carter described himself as evangelical Christian when he was elected in 1976, that was at a more religious time in U.S. history. Today, nonreligious Americans' coolness toward evangelicals dampens the acceptance of this group's candidates.
Still, there is a broad gulf between attitudes and outcomes. In the decades since Kennedy served, an uninterrupted string of white Protestant males inhabited the White House until the election of Barack Obama in 2008. The chances that an avowed atheist, or a socialist like Bernie Sanders, would be victorious in the general election would depend on not only overcoming broad public disapproval of his or her beliefs, but jumping ahead of more mainstream diverse candidates. These would include Hillary Clinton representing women and Marco Rubio representing Hispanics -- candidates who, on paper, are better positioned to break through the oval ceiling.
Survey Methods
Results for this Gallup poll are based on telephone interviews conducted June 2-7, 2015, with a random sample of 1,527 adults, aged 18 and older, living in all 50 U.S. states and the District of Columbia. The candidate characteristics were asked of a random half sample of respondents in Form A. For results based on the total sample of 771 national adults in Form A, the margin of sampling error is ±4 percentage points at the 95% confidence level. All reported margins of sampling error include computed design effects for weighting.
Each sample of national adults includes a minimum quota of 50% cellphone respondents and 50% landline respondents, with additional minimum quotas by time zone within region. Landline and cellular telephone numbers are selected using random-digit-dial methods.
Learn more about how Gallup Poll Social Series works.