Story Highlights
- July 2015 P2P second highest after October 2012 rate of 45.7%
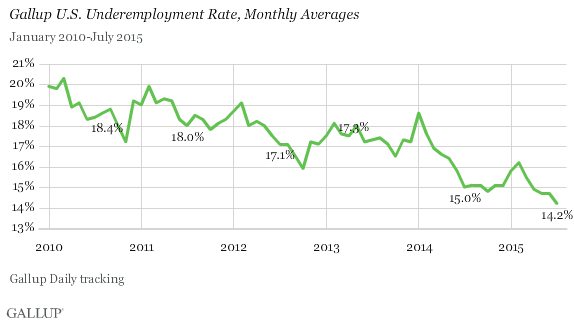
- Underemployment reaches new low of 14.2%
- Unemployment only 0.2 points lower than in July 2014
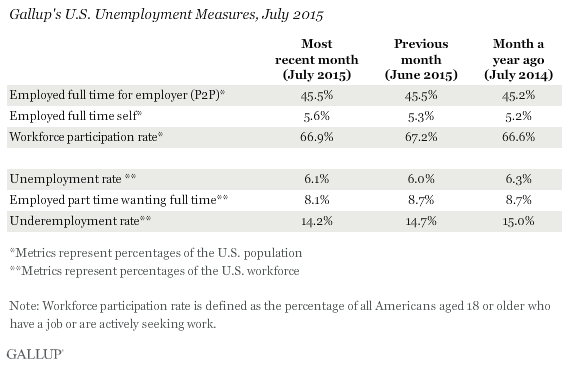
WASHINGTON, D.C. -- The U.S. Payroll to Population employment rate (P2P), as measured by Gallup, was 45.5% in July. This is unchanged from the previous month, and the highest rate Gallup has measured for any July since tracking began in 2010. The P2P measurements for the past two months tie for the second-highest recorded by Gallup after October 2012, when P2P hit 45.7%.
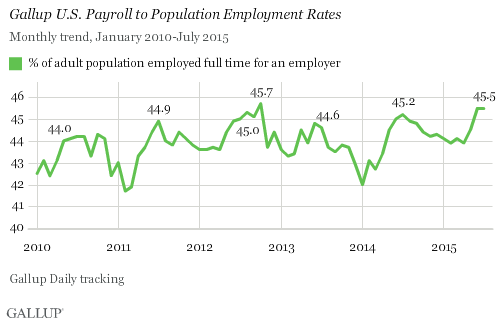
This increase in P2P rates in the summer months is in line with an expected seasonal rise in full-time employment, though the baseline trend is higher in 2015 than it has been in the past two years.
Gallup's P2P metric tracks the percentage of the U.S. adult population aged 18 and older who are working for an employer for at least 30 hours per week. P2P is not seasonally adjusted. The latest results are based on Gallup Daily tracking interviews with 30,402 Americans, conducted July 1-31 by landline telephone and cellphone. Gallup does not count adults who are self-employed, work fewer than 30 hours per week, are unemployed or are out of the workforce as payroll-employed in the P2P metric.
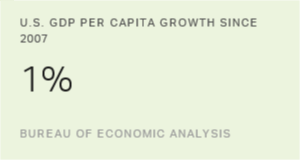
Overall, P2P is an important measure of the economy's health. P2P tracks closely with other objective measures of economic productivity, such as GDP per capita, and with subjective measures, such as life evaluations and physical well-being.
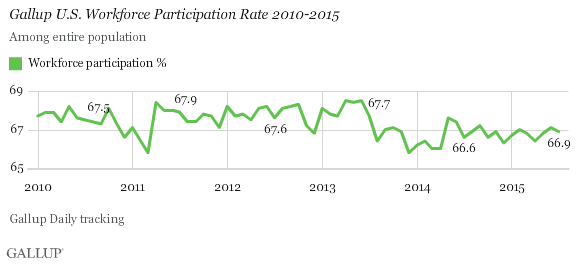
Workforce Participation at 66.9% in July
The percentage of U.S. adults participating in the workforce in July was 66.9%. While this is 0.3 percentage points higher than July of last year, it is at least 0.6 points lower than the rate measured in any other July since Gallup began tracking it in January 2010. Since that time, the workforce participation rate has remained in a narrow range, from a low of 65.8% to a high of 68.5%. But in the past two years, it has most often remained below 67.0%. Workforce participation measures the percentage of adults aged 18 and older who are working, or who are not working but are actively looking for work and are available for employment.
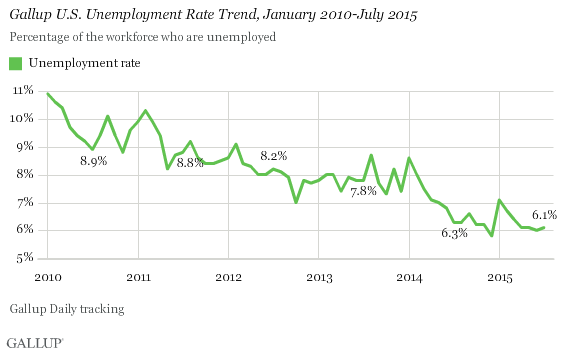
Unemployment Ticks Up to 6.1%
Gallup's unadjusted U.S. unemployment rate was 6.1% in July, up nominally from June's 6.0%, but still near the 5.8% low point from December 2014 in Gallup's five-year trend. However, after years of gradual decline, Gallup's unemployment measurement has not substantially changed from the 6.3% measured in July 2014. Gallup's U.S. unemployment rate represents the percentage of adults in the workforce who did not have any paid work in the past seven days, for an employer or themselves, and who were actively looking for and available to work.
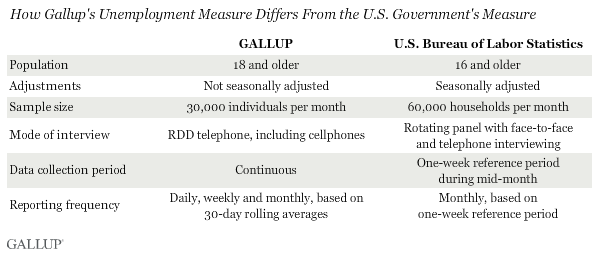
Unlike Gallup's P2P rate, which is a percentage of the total population, the unemployment rates that Gallup and the U.S. Bureau of Labor Statistics (BLS) report are percentages within the labor force. While both Gallup and BLS data are based on surveys with very large sample sizes, the two have important methodological differences -- outlined at the end of this article. Additionally, the most-discussed unemployment rate released by the BLS each month is seasonally adjusted, while Gallup reports unadjusted numbers. While Gallup's employment numbers strongly correlate with BLS rates, the BLS and Gallup estimates of unemployment do not always track precisely on a monthly basis.
Underemployment Continues Slide to 14.2%
Gallup's measure of underemployment in July is 14.2%, the lowest level recorded since Gallup began tracking it daily in 2010. Gallup's U.S. underemployment rate combines the percentage of adults in the workforce who are unemployed (6.1%) and those who are working part time but desire full-time work (8.1%).
The gradual decline in Gallup's underemployment measure has been driven almost entirely by a decline in unemployment, but last month, the 0.5-point decrease was attributable entirely to a lower rate of part-time workers who would rather be working full time. The percentage of the workforce in this category has varied between 10.1% and 8.4% since January 2010, but in July, this fell to a new low of 8.1%.
Bottom Line
P2P and unemployment were steady in July because a decline in involuntary part-time work was offset by a drop in workforce participation. The net result is that many who were working part time in June were no longer working or were no longer looking for work in July. While the underemployment rate is at its lowest point since Gallup began measuring it and continues to decrease, the decline in July is not necessarily a sign of a strengthening job market or economy. Continued drops in Gallup's Economic Confidence Index also point to underlying weaknesses despite stable P2P and unemployment numbers.
Gallup's Job Creation Index, nonetheless, continues to indicate strength, with the latest monthly numbers at a seven-year high. This may indicate that however slow and halting improvements to the labor market have been, the market still could have the power to produce more jobs for those who continue to wait for the opportunity to come knocking.
The data in this article are available in Gallup Analytics.
Gallup.com reports results from these indexes in daily, weekly and monthly averages and in Gallup.com stories. Complete trend data are always available to view and export in the following charts:
Daily: Employment, Economic Confidence and Job Creation, Consumer Spending
Weekly: Employment, Economic Confidence, Job Creation, Consumer Spending
Read more about Gallup's economic measures.
View our economic release schedule.
Survey Methods
Results for this Gallup poll are based on telephone interviews conducted July 1-31, 2015, on the Gallup U.S. Daily survey, with a random sample of 30,402 adults, aged 18 and older, living in all 50 U.S. states and the District of Columbia. For results based on the total sample of national adults, the margin of sampling error is ±1 percentage point at the 95% confidence level. All reported margins of sampling error include computed design effects for weighting.
Each sample of national adults includes a minimum quota of 50% cellphone respondents and 50% landline respondents, with additional minimum quotas by time zone within region. Landline and cellular telephone numbers are selected using random-digit-dial methods.
Learn more about how the Gallup U.S. Daily works.