Story Highlights
- Index averaged +49 in 2015, up from +45 in 2014
- About four in five satisfied with living standards in 2015
- About six in 10 said standard of living getting better in 2015
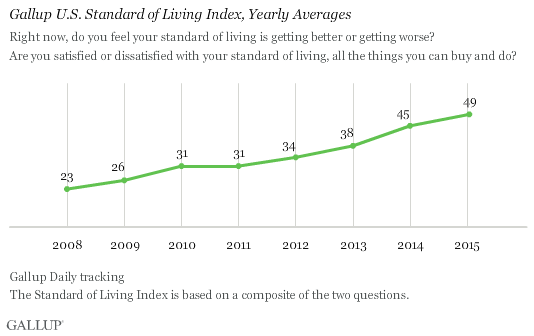
WASHINGTON, D.C. -- Americans' positivity about their standard of living was higher in 2015 than in any other year since Gallup began tracking it in 2008. The average Standard of Living Index score of +49 for 2015 was up from the average score of +45 in 2014 and more than double the +23 score in 2008.

Gallup's Standard of Living Index is a composite of Americans' responses to two questions: one asking whether they are satisfied with their standard of living, and the other asking whether their standard of living is getting better or worse. The index has a theoretical maximum of 100 (if all respondents say they are satisfied with their standard of living and say it is getting better) and a theoretical minimum of -100 (if all respondents are dissatisfied with their standard of living and say it is getting worse).
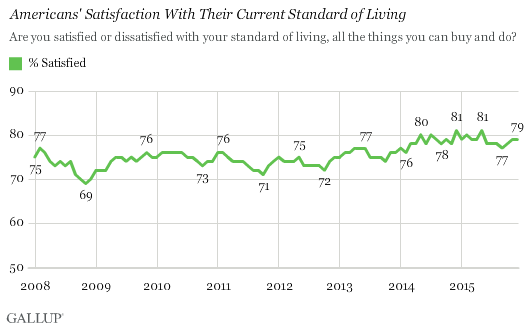
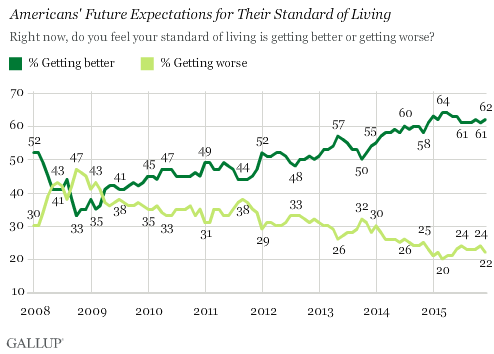
In 2015, 79% of Americans, on average, were satisfied and 21% were dissatisfied with their standard of living. Meanwhile, an average of 62% said their standard of living was getting better and 22% said it was getting worse.
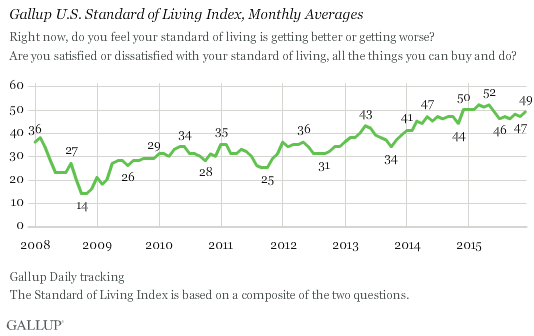
The monthly Standard of Living Index was +49 in December, down slightly from the peak of +52 reached twice in early 2015. Scores were a bit more modest in the latter half of 2015, ranging from +46 to +49, mirroring the slight decline in Americans' broader confidence in the economy. However, the late 2015 monthly scores in standard of living and economic confidence are still better than most Gallup measurements from 2008 through 2014.
The all-time low monthly average for the Standard of Living Index was +14 in October and November 2008 amid the global economic crisis.

About Four in Five Americans Are Satisfied With Their Current Standard of Living
A substantial majority of Americans have always reported being satisfied with their current standard of living, from a low of 69% saying they were satisfied in November 2008 to a high of 81% recorded in December 2014 and May 2015. In the latest monthly average, for December 2015, 79% of Americans said they were satisfied with their standard of living. This is consistent with the narrow range of 77% to 81% that this measure has remained within since March of last year.

Americans' outlook for their standard of living has varied more than their assessments of their current standard of living. They were more pessimistic than optimistic about the direction of their standard of living in late 2008 to early 2009 amid the global economic crisis, but otherwise have had a net positive outlook, with increasingly positive views in general since early 2009. The positive margin on this outlook measure has gone from just +3 points in mid-2009 to +44 points earlier this year and remained at an optimistic +40 in December.

Bottom Line
Americans' views of their standard of living were particularly rosy in 2015, having reached new heights in the first half of the year and remaining relatively high in the second half. In particular, Americans in 2015 were quite positive about the direction of their standard of living, with almost three times as many saying it was getting better as saying it was getting worse.
The highs in 2015 are consistent with the increases Gallup has observed in other economic measures in recent years, such as confidence in the U.S. economy, perceptions of job creation, and self-reports of spending.
These data are available in Gallup Analytics.
Survey Methods
Results for this Gallup poll are based on telephone interviews conducted Jan. 1-Dec. 31, 2015, on the Gallup U.S. Daily survey, with a random sample of 35,132 adults, aged 18 and older, living in all 50 U.S. states and the District of Columbia. For results based on the total sample of national adults, the margin of sampling error is ±1 percentage point at the 95% confidence level.
Each sample of national adults includes a minimum quota of 60% cellphone respondents and 40% landline respondents, with additional minimum quotas by time zone within region. Landline and cellular telephone numbers are selected using random-digit-dial methods.
Learn more about how the Gallup U.S. Daily works.


