Story Highlights
- 46% say Republicans in Congress should lead; 42% Obama
- Americans have been divided most of Obama's presidency
- Popularity of president key to determining Americans' preferences
PRINCETON, N.J. -- Americans are about evenly divided in their preference for who should have more influence over the direction the nation takes in the next year, with 46% saying the Republicans in Congress and 42% saying President Barack Obama. Americans have been mostly split on this question during Obama's presidency, with the major exception coming right after the GOP success in the 2014 midterm elections when the Republicans had a sizable lead.
![Who do you want to have more influence over the direction the nation takes in the next year -- [ROTATED: Barack Obama (or) The Republicans in Congress]?](http://content.gallup.com/origin/gallupinc/GallupSpaces/Production/Cms/POLL/hntnxzhsheq2gdpbrdgmca.png)
The latest results are based on a Jan. 6-10 Gallup poll, conducted before Obama delivered his State of the Union address on Tuesday. While his speech could affect people's views on whether he or Congress should have more influence on policy over the next year, presidents usually have not seen significant changes in their support following State of the Union addresses.
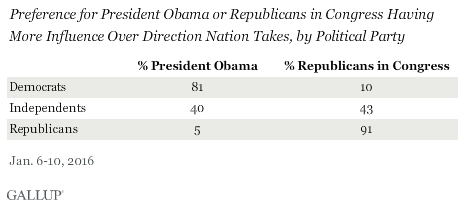
Preferences about who should steer the country are, not surprisingly, highly related to one's political party identification. But Republicans are more likely to choose their side -- 91% say the Republicans in Congress should have more influence -- than Democrats are to choose theirs -- 81% of Democrats say President Obama should have more influence. Independents are roughly divided.

Presidential Popularity Key to Influencing Preferences
Gallup has asked this question 30 times since 1995, primarily when party control of the president and Congress has been divided between the two major parties. Preferences for which side should lead have differed significantly at certain points during this time period, but when averaged, Americans have been evenly divided between the president (46%) or the opposition party in Congress (44%) having more influence.
Early in George W. Bush's administration, the public wanted him to have more influence. However, after Democrats won control of Congress in the 2006 midterms, Americans wanted the Democrats to be more influential.
![Who do you want to have more influence over the direction the nation takes in the next year -- [ROTATED: George W. Bush (or) The Democrats in Congress]?](http://content.gallup.com/origin/gallupinc/GallupSpaces/Production/Cms/POLL/xrdr-rlnf0kuh0cpgohelw.png)
During President Bill Clinton's administration, Americans wanted the Republicans in Congress to have a bigger say in leading the country after the GOP won control of Congress in the 1994 midterm elections. But in late 1998 and early 1999, when the House of Representatives was in the process of impeaching President Clinton and the Senate considering his removal from office, Americans wanted the president to lead.
![Who do you want to have more influence over the direction the nation takes in the next year -- [ROTATED: Bill Clinton (or) The Republicans in Congress]?](http://content.gallup.com/origin/gallupinc/GallupSpaces/Production/Cms/POLL/qlqafbqtbea5rlq4ncoswa.png)
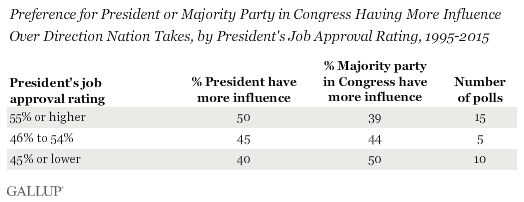
Americans' preferences to a large degree reflect their evaluation of the current president. When a president's job approval rating was 55% or higher, an average of 50% said the president should have more influence, compared with 39% for the majority party in Congress. In contrast, when a president's job approval rating was 45% or lower, the numbers are essentially reversed, with 50% wanting the congressional majority party to have more influence and 40% the president. When a president's approval rating was between 46% and 54%, Americans' preferences on who should set the direction of the nation have been evenly divided.

The current data fit this pattern. Obama's job approval rating in the Jan. 6-10 poll is 45%, which indicates a preference for the opposition party but not an overwhelming one given it is right on the edge of where Americans be split or want Congress to be more influential. More broadly and thus far in 2016, Obama has averaged a 46% job approval rating in Gallup Daily tracking.
Implications
In his State of the Union address on Tuesday, President Obama forcefully advocated his vision for how the country should address various domestic and international issues in the coming year, often taking issue with the opposing party's approach. But Americans are mostly divided as to whether he or the Republican-led Congress should have more influence over U.S. policy in the next year. To a large degree, that division is a function of Obama's middling job approval ratings; Americans tend to express a clear preference as to who should lead only when the president is very popular or very unpopular.
Historical data are available in Gallup Analytics.
Survey Methods
Results for this Gallup poll are based on telephone interviews conducted Jan. 6-10, 2016, with a random sample of 1,012 adults, aged 18 and older, living in all 50 U.S. states and the District of Columbia. For results based on the total sample of national adults, the margin of sampling error is ±4 percentage points at the 95% confidence level. All reported margins of sampling error include computed design effects for weighting.
Each sample of national adults includes a minimum quota of 60% cellphone respondents and 40% landline respondents, with additional minimum quotas by time zone within region. Landline and cellular telephone numbers are selected using random-digit-dial methods.
View complete question responses and trends.
Learn more about how Gallup Poll Social Series works.


