Story Highlights
- Four in 10 Americans rate the current situation in U.S. as positive
- This is below the historical average, although similar to recent years
- Americans are more positive about the future of the nation
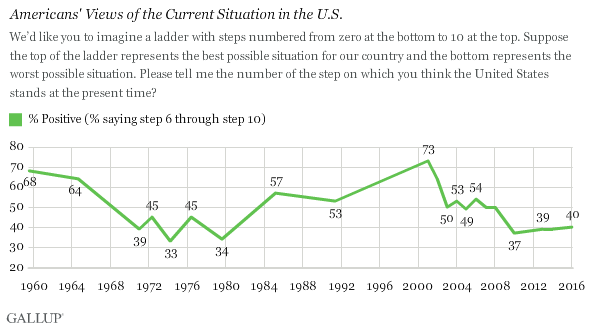
PRINCETON, N.J. -- With the first voting of the 2016 presidential election less than a week away, 40% of Americans rate the country's current situation as positive, little changed since 2010, but well below the historical average and the more positive ratings measured between 2001 and 2008.

The current rating is somewhat higher than the lows in Gallup's trends, recorded before Richard Nixon's resignation over the Watergate scandal in 1974 (33%), and in the midst of a bad economy and soaring gas prices in 1979 (34%).
These assessments are based on one of three "ladder scale" questions Gallup has used periodically since 1959. These ask Americans to rate their feelings about the country currently, in five years and five years ago, using a zero to 10 scale, where zero equals the worst possible situation for the country and 10 equals the best possible situation. Ratings between 6 and 10 are categorized as positive.
This latest assessment was included in Gallup's Mood of the Nation survey, conducted Jan. 6-10.
The 40% of Americans who assess the current state of the nation positively is below the historical average of 49% across the 21 times Gallup has asked this question. However, Gallup's trend does have gaps, with only one measure each in the 1980s and the 1990s.
Americans were most positive about the U.S. in January 2001, corresponding to the still-positive views of the economy as the dot-com boom was ending, and in January 2002, reflecting the rally effect that followed the 9/11 terrorist attacks. Americans were also quite positive on a relative basis in 1959, 1964 and 1985.
Gallup didn't ask this question in 2012, but in January 2008 -- the first month of an open-seat presidential election year, as is the case now -- 50% of Americans rated the U.S. situation as positive, 10 percentage points higher than currently. In January 2004, the year in which George W. Bush sought re-election, 53% gave positive ratings.
Today's dampened ratings are probably related to Americans' high levels of dissatisfaction with their government and the way it is operating, as well as continuing concerns about the economy and terrorism. They mirror low ratings on a separate measure of satisfaction with the way things are going in the U.S.
Democrats are sharply more positive than Republicans and independents in their assessments of the current situation in the U.S., reflecting -- as is the case with numerous other measures of the way things are going in the country -- Democrats' positive assessments of the U.S. leadership in the White House.
| Negative (0-4)% |
Neutral (5)% |
Positive (6-10)% |
|||||||||||||||||||||||||||||||||||||||||||||||||||||||||||||||||||||||||||||||||||||||||||||||||
|---|---|---|---|---|---|---|---|---|---|---|---|---|---|---|---|---|---|---|---|---|---|---|---|---|---|---|---|---|---|---|---|---|---|---|---|---|---|---|---|---|---|---|---|---|---|---|---|---|---|---|---|---|---|---|---|---|---|---|---|---|---|---|---|---|---|---|---|---|---|---|---|---|---|---|---|---|---|---|---|---|---|---|---|---|---|---|---|---|---|---|---|---|---|---|---|---|---|---|---|
| Republicans | 58 | 17 | 23 | ||||||||||||||||||||||||||||||||||||||||||||||||||||||||||||||||||||||||||||||||||||||||||||||||
| Independents | 40 | 24 | 35 | ||||||||||||||||||||||||||||||||||||||||||||||||||||||||||||||||||||||||||||||||||||||||||||||||
| Democrats | 13 | 23 | 62 | ||||||||||||||||||||||||||||||||||||||||||||||||||||||||||||||||||||||||||||||||||||||||||||||||
| Gallup, Jan. 6-10, 2016 | |||||||||||||||||||||||||||||||||||||||||||||||||||||||||||||||||||||||||||||||||||||||||||||||||||
Americans Less Positive in Their Views of Five Years Ago
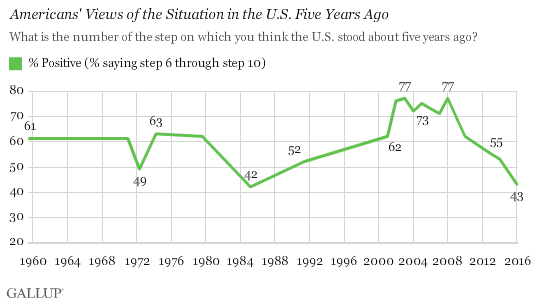
In addition to asking Americans to rate the United States' position currently, the poll asked Americans to say where the country stood five years ago. Americans' current assessments of where the nation was at that time -- at 43% positive -- are well below the historical average of 62% on this "looking back" measure. This measure is also significantly lower than it was just two years ago, in 2014.

The current percentage of Americans who rate the situation in the U.S. five years ago as positive is essentially tied with a March 1985 reading as the lowest in Gallup's trend. At that point, Americans would have been looking back to 1980, when the economy was in trouble and when American hostages were being held captive in Iran.
The explanation for the negative shift in views of the past compared with two years ago lies mainly with a change in attitudes among Republicans. In 2014, 71% of Republicans were positive about the situation in the U.S. five years before. Now, Republicans' assessments of five years ago have dropped to 47%, a much bigger drop than among independents or Democrats. In 2014, Republicans were presumably thinking back to the pre-Obama years (although 2009 was the first year of the Obama administration), while this year, Republicans may be more likely to be thinking of the early years of the Obama administration.
| Jan 5-8, 2014% |
Jan 6-10, 2016% |
||||||||||||||||||||||||||||||||||||||||||||||||||||||||||||||||||||||||||||||||||||||||||||||||||
|---|---|---|---|---|---|---|---|---|---|---|---|---|---|---|---|---|---|---|---|---|---|---|---|---|---|---|---|---|---|---|---|---|---|---|---|---|---|---|---|---|---|---|---|---|---|---|---|---|---|---|---|---|---|---|---|---|---|---|---|---|---|---|---|---|---|---|---|---|---|---|---|---|---|---|---|---|---|---|---|---|---|---|---|---|---|---|---|---|---|---|---|---|---|---|---|---|---|---|---|
| Republicans | 71 | 47 | |||||||||||||||||||||||||||||||||||||||||||||||||||||||||||||||||||||||||||||||||||||||||||||||||
| Independents | 52 | 42 | |||||||||||||||||||||||||||||||||||||||||||||||||||||||||||||||||||||||||||||||||||||||||||||||||
| Democrats | 40 | 39 | |||||||||||||||||||||||||||||||||||||||||||||||||||||||||||||||||||||||||||||||||||||||||||||||||
| Gallup | |||||||||||||||||||||||||||||||||||||||||||||||||||||||||||||||||||||||||||||||||||||||||||||||||||
Majority Are Positive About U.S. Situation in Five Years
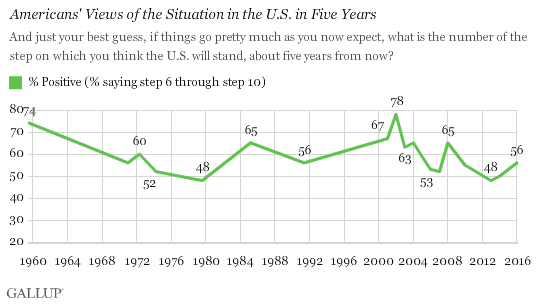
Americans' rating of where they think the U.S. will be five years hence (56% positive) is just below the historical average of 59%, although well below individual high points, including readings in the 70% range in 1959 and 2002.

Republicans are slightly less positive than independents or Democrats about the country's future in five years, even though many Republicans may be anticipating that they will have a president from their party in the White House at that time.
Implications
Perhaps the most relevant of these three measures to the 2016 presidential election is the public's rating of the current situation in the U.S., which is below the historical average.
Republicans and, to a lesser degree, independents are much less positive than Democrats -- certainly reflecting the presence of a Democrat in the White House. Republicans' dour view of the nation may also lead them to believe that even a new Republican president will need to change the way business is done in Washington to improve the situation. If so, this may help in understanding how Donald Trump's nonpolitical background and his "anything but business as usual" presentation of self have resonated well with segments of the GOP. Republicans' negativity about the current situation in the U.S. may also help explain why other GOP candidates with more traditional political backgrounds -- such as Ted Cruz -- have been attempting to position themselves as best suited to shake up the system.
Hillary Clinton's mainstream political resume may appeal to Democrats because more than six in 10 are positive about the current situation in the U.S., and therefore presumably not averse to a traditional Democratic president who continues those policies. Bernie Sanders, although a sitting U.S. senator, is more of a maverick, and presumably hopes that even with Democrats' relatively positive assessments of the state of the nation, they may be open to the types of more significant changes in Washington policies that he is proposing.
Historical data are available in Gallup Analytics.
Survey Methods
Results for this Gallup poll are based on telephone interviews conducted Jan. 6-10, 2016, with a random sample of 1,012 adults, aged 18 and older, living in all 50 U.S. states and the District of Columbia. For results based on the total sample of national adults, the margin of sampling error is ±4 percentage points at the 95% confidence level. All reported margins of sampling error include computed design effects for weighting.
Each sample of national adults includes a minimum quota of 60% cellphone respondents and 40% landline respondents, with additional minimum quotas by time zone within region. Landline and cellular telephone numbers are selected using random-digit-dial methods.
View survey methodology, complete question responses and trends.
Learn more about how Gallup Poll Social Series works.


