Story Highlights
- 58% of Democrats say Clinton would be great/good president
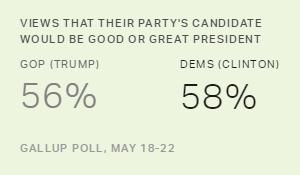
- Similar percentage of Republicans say Trump would be great/good president
- Most Americans are positive about the presidency of at least one candidate
PRINCETON, N.J. -- Twenty-two percent of Democrats and independents who lean Democratic say Hillary Clinton would be a great president if elected, similar to the 19% of Republicans and Republican leaners who say the same about Donald Trump. Most of the rest of each partisan group say their party's candidate would be either a good or an average president. Positive sentiments are by no means universal within either party, however; 21% of Republicans say Trump would be a poor or terrible president, while 13% of Democrats say that about Clinton.
| Great | Good | Average | Poor | Terrible | Don't know | ||||||||||||||||||||||||||||||||||||||||||||||||||||||||||||||||||||||||||||||||||||||||||||||
|---|---|---|---|---|---|---|---|---|---|---|---|---|---|---|---|---|---|---|---|---|---|---|---|---|---|---|---|---|---|---|---|---|---|---|---|---|---|---|---|---|---|---|---|---|---|---|---|---|---|---|---|---|---|---|---|---|---|---|---|---|---|---|---|---|---|---|---|---|---|---|---|---|---|---|---|---|---|---|---|---|---|---|---|---|---|---|---|---|---|---|---|---|---|---|---|---|---|---|---|
| % | % | % | % | % | % | ||||||||||||||||||||||||||||||||||||||||||||||||||||||||||||||||||||||||||||||||||||||||||||||
| Hillary Clinton | |||||||||||||||||||||||||||||||||||||||||||||||||||||||||||||||||||||||||||||||||||||||||||||||||||
| Democrats/Democratic leaners | |||||||||||||||||||||||||||||||||||||||||||||||||||||||||||||||||||||||||||||||||||||||||||||||||||
| May 18-22, 2016 | 22 | 36 | 26 | 8 | 5 | 3 | |||||||||||||||||||||||||||||||||||||||||||||||||||||||||||||||||||||||||||||||||||||||||||||
| Dec 14-16, 2007 | 33 | 43 | 17 | 4 | 3 | 1 | |||||||||||||||||||||||||||||||||||||||||||||||||||||||||||||||||||||||||||||||||||||||||||||
| Donald Trump | |||||||||||||||||||||||||||||||||||||||||||||||||||||||||||||||||||||||||||||||||||||||||||||||||||
| Republicans/Republican leaners | |||||||||||||||||||||||||||||||||||||||||||||||||||||||||||||||||||||||||||||||||||||||||||||||||||
| May 18-22, 2016 | 19 | 37 | 20 | 11 | 10 | 3 | |||||||||||||||||||||||||||||||||||||||||||||||||||||||||||||||||||||||||||||||||||||||||||||
| Apr 20-23, 2011 | 10 | 24 | 24 | 20 | 13 | 9 | |||||||||||||||||||||||||||||||||||||||||||||||||||||||||||||||||||||||||||||||||||||||||||||
| Gallup | |||||||||||||||||||||||||||||||||||||||||||||||||||||||||||||||||||||||||||||||||||||||||||||||||||
These data are from a Gallup poll conducted May 18-22. Gallup asked similar questions about these two candidates at different times in previous election cycles -- Clinton in December 2007 as she was making her first bid for the presidency and Trump in April 2011.
The percentage of Republicans who think Trump would be a great or good president is considerably higher now (56%) than was true in 2011 (34%). Trump's campaigning and status as the presumptive Republican nominee have apparently convinced Republicans of his potential virtues as president compared with what they might have thought when he was flirting with the idea of running before the 2012 election.
The opposite pattern has occurred relating to Democrats' views of Clinton. In December 2007, before her battle with Barack Obama for the Democratic nomination began in earnest, 76% of Democrats thought she would be a great or good president, higher than the 58% who feel that way today.
Fourteen Percent Say Both Trump and Clinton Would Be Poor or Terrible President
Because Gallup asked each American in this survey to rate potential Trump and Clinton presidencies, the responses can be combined to show how the two candidates are rated together. As the accompanying table shows (and as one would expect), Americans are most likely to rate one candidate positively and at the same time rate the other negatively. This includes the 26% who say Clinton would be great or good and at the same time think Trump would be poor or terrible, and the 23% who hold the opposite views -- that Trump would be great or good and that Clinton would be poor or terrible.
| Trump: Great/Good | Trump: Average | Trump: Poor/Terrible | |||||||||||||||||||||||||||||||||||||||||||||||||||||||||||||||||||||||||||||||||||||||||||||||||
|---|---|---|---|---|---|---|---|---|---|---|---|---|---|---|---|---|---|---|---|---|---|---|---|---|---|---|---|---|---|---|---|---|---|---|---|---|---|---|---|---|---|---|---|---|---|---|---|---|---|---|---|---|---|---|---|---|---|---|---|---|---|---|---|---|---|---|---|---|---|---|---|---|---|---|---|---|---|---|---|---|---|---|---|---|---|---|---|---|---|---|---|---|---|---|---|---|---|---|---|
| % | % | % | |||||||||||||||||||||||||||||||||||||||||||||||||||||||||||||||||||||||||||||||||||||||||||||||||
| Clinton: Great/Good | 2 | 2 | 26 | ||||||||||||||||||||||||||||||||||||||||||||||||||||||||||||||||||||||||||||||||||||||||||||||||
| Clinton: Average | 3 | 3 | 12 | ||||||||||||||||||||||||||||||||||||||||||||||||||||||||||||||||||||||||||||||||||||||||||||||||
| Clinton: Poor/Terrible | 23 | 9 | 14 | ||||||||||||||||||||||||||||||||||||||||||||||||||||||||||||||||||||||||||||||||||||||||||||||||
| Gallup, May 18-22, 2016 | |||||||||||||||||||||||||||||||||||||||||||||||||||||||||||||||||||||||||||||||||||||||||||||||||||
Of particular interest is the 14% of Americans who say both candidates would be poor or terrible presidents.
Roughly two-thirds of this group of 14% who are negative about potential Trump and Clinton presidencies identify initially as political independents (before they are asked which way they lean). Another 24% of this group are Republicans, while 12% are Democrats. Because Republicans and Democrats are about equally represented in the survey, the larger proportion of Republicans believing that both candidates would be bad presidents underscores that Republicans are more concerned than Democrats about their own party's nominee.
| Republicans | Independents | Democrats | |||||||||||||||||||||||||||||||||||||||||||||||||||||||||||||||||||||||||||||||||||||||||||||||||
|---|---|---|---|---|---|---|---|---|---|---|---|---|---|---|---|---|---|---|---|---|---|---|---|---|---|---|---|---|---|---|---|---|---|---|---|---|---|---|---|---|---|---|---|---|---|---|---|---|---|---|---|---|---|---|---|---|---|---|---|---|---|---|---|---|---|---|---|---|---|---|---|---|---|---|---|---|---|---|---|---|---|---|---|---|---|---|---|---|---|---|---|---|---|---|---|---|---|---|---|
| % | % | % | |||||||||||||||||||||||||||||||||||||||||||||||||||||||||||||||||||||||||||||||||||||||||||||||||
| Party identification among those who say both Trump and Clinton would be poor/terrible president | 24 | 64 | 12 | ||||||||||||||||||||||||||||||||||||||||||||||||||||||||||||||||||||||||||||||||||||||||||||||||
| Party identification among those with all other views | 28 | 42 | 30 | ||||||||||||||||||||||||||||||||||||||||||||||||||||||||||||||||||||||||||||||||||||||||||||||||
| Gallup, May 18-22, 2016 | |||||||||||||||||||||||||||||||||||||||||||||||||||||||||||||||||||||||||||||||||||||||||||||||||||
Americans younger than 30 are significantly overrepresented in the group of those who think both Clinton and Trump would be poor or terrible presidents. This is to some degree related to young people's support for Bernie Sanders for president. The views of Sanders' supporters could change when he eventually withdraws from the race.
| 18 to 29 | 30 to 49 | 50 to 64 | 65+ | ||||||||||||||||||||||||||||||||||||||||||||||||||||||||||||||||||||||||||||||||||||||||||||||||
|---|---|---|---|---|---|---|---|---|---|---|---|---|---|---|---|---|---|---|---|---|---|---|---|---|---|---|---|---|---|---|---|---|---|---|---|---|---|---|---|---|---|---|---|---|---|---|---|---|---|---|---|---|---|---|---|---|---|---|---|---|---|---|---|---|---|---|---|---|---|---|---|---|---|---|---|---|---|---|---|---|---|---|---|---|---|---|---|---|---|---|---|---|---|---|---|---|---|---|---|
| % | % | % | % | ||||||||||||||||||||||||||||||||||||||||||||||||||||||||||||||||||||||||||||||||||||||||||||||||
| Age distribution among those who say both Trump and Clinton would be poor/terrible president | 36 | 34 | 21 | 10 | |||||||||||||||||||||||||||||||||||||||||||||||||||||||||||||||||||||||||||||||||||||||||||||||
| Age distribution among those with all other views | 19 | 32 | 27 | 22 | |||||||||||||||||||||||||||||||||||||||||||||||||||||||||||||||||||||||||||||||||||||||||||||||
| Gallup, May 18-22, 2016 | |||||||||||||||||||||||||||||||||||||||||||||||||||||||||||||||||||||||||||||||||||||||||||||||||||
Implications
Some speculation in this presidential race has centered on the perception that Americans are dissatisfied with the prospect of either Clinton or Trump as the next president. This is partly based on Americans' low favorable ratings of each, as well as other measures indicating Americans' frustrations with how the nomination contests have played out. But these data reveal that only 14% of Americans think that both candidates would be poor or terrible presidents. Most Americans think that at least one of the two would be at least an average president if he or she were to take office next January.
Additionally, the substantial majority of Democrats and of Republicans believe that Clinton and Trump, respectively, would be at least an average president, with majorities saying they would be great or good. This positivity is muted, however, with about one-fifth of each partisan group willing to say their candidate would be a great president.
These perceptions may change as the campaign progresses, just as views of the type of president Clinton and Trump would be have changed since 2007 and 2011. For one thing, Sanders remains an active competitor to Clinton, and Sanders' supporters may be reluctant to say positive things about her until he exits the race. Trump is new on the political scene, and as his campaign continues, the public may become more convinced or less convinced of his ability to handle the job of being president.
These data are available in Gallup Analytics.
Survey Methods
Results for this Gallup poll are based on telephone interviews conducted May 18-22, 2016, with a random sample of 1,530 adults, aged 18 and older, living in all 50 U.S. states and the District of Columbia. For results based on the total sample of national adults, the margin of sampling error is ±3 percentage points at the 95% confidence level. For results based on the sample of 744 Republicans and Republican-leaning independents, the margin of sampling error is ±4 percentage points at the 95% confidence level. For results based on the sample of 697 Democrats and Democratic-leaning independents, the margin of sampling error is ±5 percentage points at the 95% confidence level. All reported margins of sampling error include computed design effects for weighting.
Each sample of national adults includes a minimum quota of 60% cellphone respondents and 40% landline respondents, with additional minimum quotas by time zone within region. Landline and cellular telephone numbers are selected using random-digit-dial methods.
View survey methodology, complete question responses and trends.
Learn more about how the Gallup Poll Social Series works.