Story Highlights
- 12% of Republicans approve, below the 16% national average
- Republicans have registered lower approval since last summer
- Prior GOP-led Congresses rated much more positively by Republicans
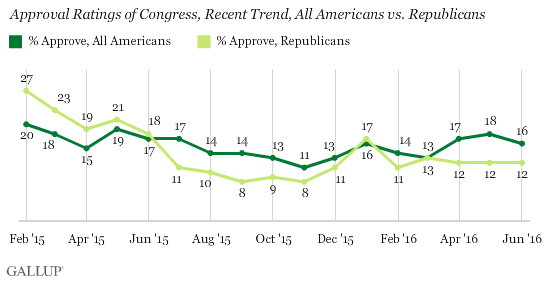
PRINCETON, N.J. -- Just 12% of Republicans approve of the job Congress is doing, a lower rating than the historically subpar rating all Americans (16%) give the GOP-led institution. Immediately after the Republican Party took control of both houses of Congress in early 2015, Republican identifiers were more positive than the general public about Congress, but by the summer of that year Republicans' approval dropped below the national average.

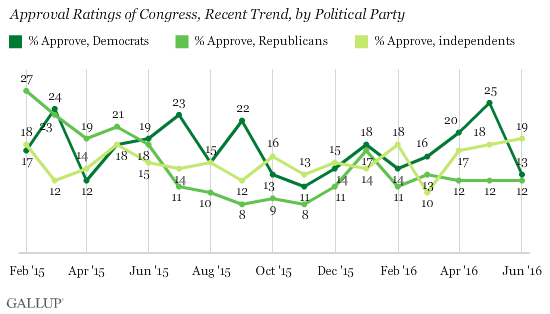
Since last July, Republican approval has averaged 11%, compared with 15% for independents and 17% for Democrats. The recent trends for all three major party groups are shown in a graph at the end of this article.
Republicans have failed to make progress in getting their preferred legislation passed since they gained control of the Senate in early 2015. John Boehner resigned as speaker last fall as a result of unhappiness with his leadership among many Republican House members, not to mention Republican Party supporters more generally. After a prolonged search to find a replacement, the GOP tapped Paul Ryan as its new House leader. However, that has done little to improve Republicans' evaluations of the way Congress is handling its job.
In the past, supporters of the majority party may have been happy just to have their party in power. Over the past two decades, the majority party's supporters have given Congress significantly higher job approval ratings than supporters of the opposition party when one party had control of both houses of Congress. These data go back to 1993, when Gallup began compiling approval of Congress by party.
| Years | Majority party in House and Senate | Average approval, Republicans | Average approval, Democrats | Gap in favor of majority party | |||||||||||||||||||||||||||||||||||||||||||||||||||||||||||||||||||||||||||||||||||||||||||||||
|---|---|---|---|---|---|---|---|---|---|---|---|---|---|---|---|---|---|---|---|---|---|---|---|---|---|---|---|---|---|---|---|---|---|---|---|---|---|---|---|---|---|---|---|---|---|---|---|---|---|---|---|---|---|---|---|---|---|---|---|---|---|---|---|---|---|---|---|---|---|---|---|---|---|---|---|---|---|---|---|---|---|---|---|---|---|---|---|---|---|---|---|---|---|---|---|---|---|---|---|
| % | % | pct. pts. | |||||||||||||||||||||||||||||||||||||||||||||||||||||||||||||||||||||||||||||||||||||||||||||||||
| 1993-1994 | Democratic | 21 | 31 | +10 | |||||||||||||||||||||||||||||||||||||||||||||||||||||||||||||||||||||||||||||||||||||||||||||||
| 1995-2000 | Republican | 52 | 36 | +16 | |||||||||||||||||||||||||||||||||||||||||||||||||||||||||||||||||||||||||||||||||||||||||||||||
| 2003-2006 | Republican | 55 | 25 | +30 | |||||||||||||||||||||||||||||||||||||||||||||||||||||||||||||||||||||||||||||||||||||||||||||||
| 2007-2010 | Democratic | 18 | 33 | +15 | |||||||||||||||||||||||||||||||||||||||||||||||||||||||||||||||||||||||||||||||||||||||||||||||
| 2015-2016 | Republican | 14 | 17 | -3 | |||||||||||||||||||||||||||||||||||||||||||||||||||||||||||||||||||||||||||||||||||||||||||||||
| Note : 2001-2002 and 2011-2014 not included because control of Congress was shared, with one party controlling the House and the other the Senate. | |||||||||||||||||||||||||||||||||||||||||||||||||||||||||||||||||||||||||||||||||||||||||||||||||||
| Gallup | |||||||||||||||||||||||||||||||||||||||||||||||||||||||||||||||||||||||||||||||||||||||||||||||||||
To illustrate, when the GOP was the majority party in 1995 through 2000, Republican approval of Congress was 16 percentage points higher on average than that of Democrats, 52% to 36%. The gap was even larger -- 30 points -- from 2003 through 2006, perhaps because Republican George W. Bush was president at the time.
Democrats were also much more positive toward Congress in the two recent periods in which they were the majority party. From 1993 through 1994, Democrats' average approval rating of Congress was 10 points higher than that of Republicans. And from 2007 to 2010, Democrats' ratings were 15 points higher on average.
In the current period, which includes the initial months of 2015 when Republicans were more positive toward Congress, Republicans' approval ratings have averaged three points lower than Democrats', 14% to 17%.
Implications
Rank-and-file Republicans are not alone in having a negative opinion of Congress, as independents' and Democrats' approval ratings are also currently low from a historical perspective. But Republicans are unusual in giving Congress lower approval at a time when their party has control of both houses. In the past, supporters of the majority party typically had approval ratings at least 10 points higher than supporters of the opposition party.
Republicans' negativity toward the GOP-led Congress is not merely a function of there being divided government. Republicans were more positive than Democrats toward the GOP-led Congress when Democrat Bill Clinton was president in the 1990s. Likewise, Democrats were more positive than Republicans toward the Democratically controlled Congress in 2007 and 2008 when Bush was president.
Nor are Republicans' lower ratings of Congress attributable to unawareness of or confusion as to which party controls Congress -- 64% of Americans and 69% of Republicans correctly identify the Republican Party as the majority party in the House. Those were easily the highest scores on five questions testing Americans' knowledge of Congress included in the June 1-5 poll.
Republicans' frustration with their own party leadership, in both the House and Senate, likely contributed to their negative evaluations of Congress. Some Republicans are probably upset with the leadership for not doing more to pass legislation to address the nation's problems, even if that meant compromising with Democrats. Other Republicans may have been unhappy with the leadership for failing to take a more aggressive approach against President Barack Obama and the Democrats, wanting Republicans to pass GOP-favored legislation even in the face of a certain presidential veto and to take active steps to thwart the president's ability to pass legislation he favored. Regardless, the change in the House leadership last fall seems to have done little to make Republicans feel better about Congress.
Republican approval of Congress would almost surely improve if Donald Trump were elected president in 2016 and the party maintained control of both houses of Congress, mainly because Republicans would see more of their preferred legislation passed than has been the case with Obama in the White House. However, if Hillary Clinton is elected along with a Republican Congress, it is unlikely that much would change to make Republicans feel better about the way Congress is doing its job.
Historical data are available in Gallup Analytics.
Survey Methods
Results for this Gallup poll are based on telephone interviews conducted June 1-5, 2016, with a random sample of 1,027 adults, aged 18 and older, living in all 50 U.S. states and the District of Columbia. For results based on the total sample of national adults, the margin of sampling error is ±3 percentage points at the 95% confidence level.
For results based on the total samples of 308 Republicans and 313 Democrats, the margins of sampling error are ±7 percentage points at the 95% confidence level.
For results based on the total sample of 386 independents, the margin of sampling error is ±6 percentage points at the 95% confidence level.
All reported margins of sampling error include computed design effects for weighting.
Each sample of national adults includes a minimum quota of 60% cellphone respondents and 40% landline respondents, with additional minimum quotas by time zone within region. Landline and cellular telephone numbers are selected using random-digit-dial methods.
View survey methodology, complete question responses and trends.
Learn more about how the Gallup Poll Social Series works.


