Story Highlights
- Seven in 10 Americans say merit should be only basis for college admissions
- 65% disagree with Supreme Court decision allowing race to be a factor
- By 50% to 44%, blacks favor merit, not race
PRINCETON, N.J. -- Americans continue to believe colleges should admit applicants based solely on merit (70%), rather than taking into account applicants' race and ethnicity in order to promote diversity (26%). These findings suggest Americans would disagree with the Supreme Court's recent decision in Fisher v. University of Texas, in which the court essentially ruled that colleges can continue to consider race as a factor in their admissions decisions to increase diversity on their campuses.
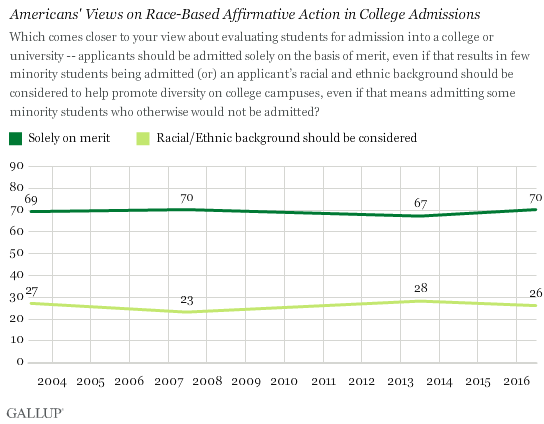
Gallup previously asked this question as part of its Minority Rights and Relations poll in 2003, 2007 and 2013, and Americans' views since 2003 have held steady.
Gallup, in collaboration with Inside Higher Ed, also asked a slightly different question focusing directly on the Fisher v. University of Texas decision in a separate June 29-July 2 poll. The question described it as "a case that confirms that colleges can consider the race or ethnicity of students when making decisions on who to admit to the college." The results were similar to the more generic Gallup trend question, with 65% disapproving and 31% approving of the Supreme Court decision.
| Approve | Disapprove | No opinion | |||||||||||||||||||||||||||||||||||||||||||||||||||||||||||||||||||||||||||||||||||||||||||||||||
|---|---|---|---|---|---|---|---|---|---|---|---|---|---|---|---|---|---|---|---|---|---|---|---|---|---|---|---|---|---|---|---|---|---|---|---|---|---|---|---|---|---|---|---|---|---|---|---|---|---|---|---|---|---|---|---|---|---|---|---|---|---|---|---|---|---|---|---|---|---|---|---|---|---|---|---|---|---|---|---|---|---|---|---|---|---|---|---|---|---|---|---|---|---|---|---|---|---|---|---|
| % | % | % | |||||||||||||||||||||||||||||||||||||||||||||||||||||||||||||||||||||||||||||||||||||||||||||||||
| Jun 29-Jul 2, 2016 | 31 | 65 | 4 | ||||||||||||||||||||||||||||||||||||||||||||||||||||||||||||||||||||||||||||||||||||||||||||||||
| Gallup | |||||||||||||||||||||||||||||||||||||||||||||||||||||||||||||||||||||||||||||||||||||||||||||||||||
Americans were asked in the latter poll to react to a list of nine factors that colleges and universities could consider when making admissions decisions. Using a question format that differed from the way the first two questions were asked, the results still showed that Americans tend to reject taking race into account in such decisions, with 63% saying race or ethnicity should not be a factor at all in admissions and 9% saying that they should be a "major factor."
Americans' low support for taking race/ethnicity into account stands in sharp contrast to their widespread agreement that high school grades should be a major factor in admissions. A majority of Americans also say that scores on standardized tests and the types of courses a student takes in high school should weigh heavily.
| Major factor | Minor factor | Not a factor | No opinion | ||||||||||||||||||||||||||||||||||||||||||||||||||||||||||||||||||||||||||||||||||||||||||||||||
|---|---|---|---|---|---|---|---|---|---|---|---|---|---|---|---|---|---|---|---|---|---|---|---|---|---|---|---|---|---|---|---|---|---|---|---|---|---|---|---|---|---|---|---|---|---|---|---|---|---|---|---|---|---|---|---|---|---|---|---|---|---|---|---|---|---|---|---|---|---|---|---|---|---|---|---|---|---|---|---|---|---|---|---|---|---|---|---|---|---|---|---|---|---|---|---|---|---|---|---|
| % | % | % | % | ||||||||||||||||||||||||||||||||||||||||||||||||||||||||||||||||||||||||||||||||||||||||||||||||
| High school grades | 73 | 20 | 6 | 1 | |||||||||||||||||||||||||||||||||||||||||||||||||||||||||||||||||||||||||||||||||||||||||||||||
| Scores on standardized tests like the SAT or ACT | 55 | 33 | 10 | 2 | |||||||||||||||||||||||||||||||||||||||||||||||||||||||||||||||||||||||||||||||||||||||||||||||
| The types of courses the student took in high school | 50 | 31 | 19 | 1 | |||||||||||||||||||||||||||||||||||||||||||||||||||||||||||||||||||||||||||||||||||||||||||||||
| The family's economic circumstances | 31 | 30 | 39 | 1 | |||||||||||||||||||||||||||||||||||||||||||||||||||||||||||||||||||||||||||||||||||||||||||||||
| Whether the student would be the first person in the family to attend college | 31 | 27 | 41 | 1 | |||||||||||||||||||||||||||||||||||||||||||||||||||||||||||||||||||||||||||||||||||||||||||||||
| Athletic ability | 15 | 40 | 44 | 1 | |||||||||||||||||||||||||||||||||||||||||||||||||||||||||||||||||||||||||||||||||||||||||||||||
| Parent is an alumni of the school | 11 | 35 | 52 | 2 | |||||||||||||||||||||||||||||||||||||||||||||||||||||||||||||||||||||||||||||||||||||||||||||||
| Race or ethnicity | 9 | 27 | 63 | 1 | |||||||||||||||||||||||||||||||||||||||||||||||||||||||||||||||||||||||||||||||||||||||||||||||
| Gender | 8 | 25 | 66 | 2 | |||||||||||||||||||||||||||||||||||||||||||||||||||||||||||||||||||||||||||||||||||||||||||||||
| Gallup, June 29-July 2, 2016 | |||||||||||||||||||||||||||||||||||||||||||||||||||||||||||||||||||||||||||||||||||||||||||||||||||
Differences by Race
There are differences between whites, blacks and Hispanics in response to the question asking if race or ethnicity should be taken into account in college admissions decisions in order to promote diversity, with 44% of blacks agreeing, compared with 22% of whites and 29% of Hispanics. Still, half of blacks are more likely to agree with the merit approach.
At the same time, these groups' views of the Supreme Court decision are similar, with all three much more likely to disapprove of it than approve.
When asked about the list of nine possible factors colleges can consider in admissions, whites are less likely than blacks or Hispanics to say race should be a major factor in colleges' decisions. But the differences are only a matter of degree: 4% of whites, 17% of blacks and 26% of Hispanics say race and ethnicity should be a major factor.
| Non-Hispanic whites | Non-Hispanic blacks | Hispanics | ||||||||||||||||||||||||||||||||||||||||||||||||||||||||||||||||||||||||||||||||||||||||||||||||||
|---|---|---|---|---|---|---|---|---|---|---|---|---|---|---|---|---|---|---|---|---|---|---|---|---|---|---|---|---|---|---|---|---|---|---|---|---|---|---|---|---|---|---|---|---|---|---|---|---|---|---|---|---|---|---|---|---|---|---|---|---|---|---|---|---|---|---|---|---|---|---|---|---|---|---|---|---|---|---|---|---|---|---|---|---|---|---|---|---|---|---|---|---|---|---|---|---|---|---|---|---|
| % | % | % | ||||||||||||||||||||||||||||||||||||||||||||||||||||||||||||||||||||||||||||||||||||||||||||||||||
| Evaluating students for college admissions | ||||||||||||||||||||||||||||||||||||||||||||||||||||||||||||||||||||||||||||||||||||||||||||||||||||
| Admit applicants solely on merit | 76 | 50 | 61 | |||||||||||||||||||||||||||||||||||||||||||||||||||||||||||||||||||||||||||||||||||||||||||||||||
| Take race/ethnicity into account | 22 | 44 | 29 | |||||||||||||||||||||||||||||||||||||||||||||||||||||||||||||||||||||||||||||||||||||||||||||||||
| Approve or disapprove of Supreme Court's decision? | ||||||||||||||||||||||||||||||||||||||||||||||||||||||||||||||||||||||||||||||||||||||||||||||||||||
| Approve | 30 | 35 | 25 | |||||||||||||||||||||||||||||||||||||||||||||||||||||||||||||||||||||||||||||||||||||||||||||||||
| Disapprove | 66 | 63 | 65 | |||||||||||||||||||||||||||||||||||||||||||||||||||||||||||||||||||||||||||||||||||||||||||||||||
| How should race or ethnicity factor into admissions decisions? | ||||||||||||||||||||||||||||||||||||||||||||||||||||||||||||||||||||||||||||||||||||||||||||||||||||
| Should be a major factor | 4 | 17 | 26 | |||||||||||||||||||||||||||||||||||||||||||||||||||||||||||||||||||||||||||||||||||||||||||||||||
| Should be a minor factor | 29 | 26 | 20 | |||||||||||||||||||||||||||||||||||||||||||||||||||||||||||||||||||||||||||||||||||||||||||||||||
| Should not be a factor at all | 67 | 57 | 47 | |||||||||||||||||||||||||||||||||||||||||||||||||||||||||||||||||||||||||||||||||||||||||||||||||
| Gallup, June 7-July 1, 2016 (Evaluating question); June 29-July 1, 2016 (Supreme Court and Factor questions) | ||||||||||||||||||||||||||||||||||||||||||||||||||||||||||||||||||||||||||||||||||||||||||||||||||||
Implications
The Fisher v. University of Texas Supreme Court decision does not require colleges to take race and ethnicity into account, but makes it constitutionally legal to do so if it promotes diversity in certain situations. Many colleges and universities who are selective in their admissions process already use racial and ethnic background as a factor in making admissions decisions, and college presidents have come out in support of the Supreme Court decision, which allows them to continue that practice. However, the process seems to run counter to Americans' belief that race should not be a factor in making college admissions decisions.
It is possible that when Americans think about taking race into account, they think mostly about race being used to discriminate against minorities and to prevent them from having equal opportunities -- rather than the reverse issue at the heart of the Supreme Court decision, which involves taking race into account in ways that help minorities.
Americans also might not understand the reasons colleges feel committed to increasing racial and ethnic diversity. But Gallup finds that Americans who say they are most familiar with the college admissions process in the June 29-July 2 survey do not differ substantially from others in their views of the Supreme Court decision, or on whether race and ethnicity should be a factor in the college admissions process. Therefore, lack of knowledge about college admissions does not appear to be driving Americans' rejection of race-sensitive admissions.
Read Inside Higher Ed's analysis of the data.
These data are available in Gallup Analytics.
Survey Methods
Results for this Gallup poll are based on telephone interviews conducted June 7-July 1, 2016, with a sample of 3,270 adults, aged 18 and older, living in all 50 U.S. states and the District of Columbia, who had previously been interviewed in the Gallup Daily tracking poll and agreed to be re-interviewed for a later study. The sample is weighted to be representative of U.S. adults.
For results based on the total sample of national adults, the margin of sampling error is ±3 percentage points at the 95% confidence level. For results based on the sample of 1,320 non-Hispanic whites, the margin of sampling error is ±4 percentage points at the 95% confidence level. For results based on the sample of 912 non-Hispanic blacks, the margin of sampling error is ±5 percentage points at the 95% confidence level. For results based on the sample of 906 Hispanics, the margin of sampling error is ±6 percentage points at the 95% confidence level. (271 out of the 906 interviews with Hispanics were conducted in Spanish.)
All reported margins of sampling error include computed design effects for weighting.
Results for questions asked June 29-July 1, 2016, as part of Gallup Daily interviewing, are based on the total sample of 2,036 adults, aged 18 and older. For results based on the total sample of national adults, the margin of sampling error is ±3% at the 95% confidence level. For results based on the total sample of 1,526 non-Hispanic whites, the margin of sampling error is ±4 percentage points at the 95% confidence level. For results based on the total sample of 182 non-Hispanic blacks, the margin of sampling error is ±7 percentage points at the 95% confidence level. For results based on the total sample of 195 Hispanics, the margin of sampling error is ±7 percentage points at the 95% confidence level. All reported margins of sampling error include computed design effects for weighting.
Each sample of national adults includes a minimum quota of 60% cellphone respondents and 40% landline respondents, with additional minimum quotas by time zone within region. Landline and cellular telephone numbers are selected using random-digit-dial methods.
View survey methodology, complete question responses and trends.
Learn more about how the Gallup Poll Social Series works.