Story Highlights
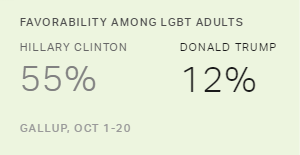
- Clinton's favorability among LGBT adults is 55%; Trump's is 12%
- LGBT adults favor Clinton more, Trump less than non-LGBT adults
- Race and ethnicity are not a factor in LGBT views of candidates
WASHINGTON, D.C. -- Democratic candidates have historically garnered widespread support among the lesbian, gay, bisexual and transgender (LGBT) community, and this year is no exception. So far in October, 55% of LGBT adults view Democrat Hillary Clinton favorably, similar to the majority viewing her favorably since the primaries wrapped in June. By contrast, barely one in eight LGBT adults (12%) view Republican Donald Trump favorably, also consistent with ranges since June.
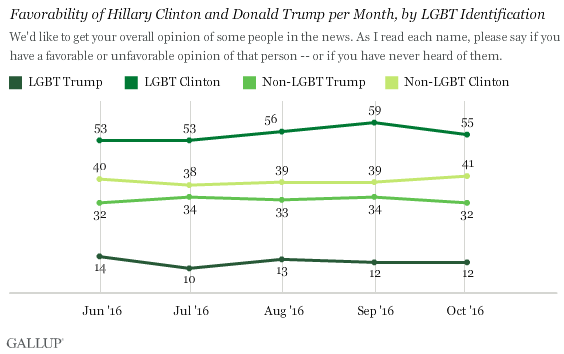
LGBT Americans view Clinton more positively than non-LGBT Americans do, with 55% and 41%, respectively, rating her favorably. At the same time, LGBT Americans, at 12%, view Trump much less favorably than non-LGBT Americans do, at 32%. The favorability of both candidates has not varied much since June.
These results are based on Gallup Daily tracking and include more than 450 individuals each month who self-identify as lesbian, gay, bisexual or transgender from June through September, and 282 from Oct. 1-20. Before June, LGBT adults were slightly more favorable toward Trump, giving him an average 17% favorable rating from January through May, compared with 32% of the non-LGBT population. Opinions of Clinton from January through May were similar to where they have been in recent months among both groups.
Although vote preferences cannot be directly inferred from favorable ratings, the favorability data suggest Clinton should fare much better among LGBT voters than Trump, consistent with the LGBT community's previous support for Democratic presidential candidates. For example, 76% of LGBT adults supported Democratic nominee Barack Obama in the 2012 election, compared with 22% who voted for Republican candidate Mitt Romney.
Candidate Favorability by Demographic Characteristics
Previous Gallup research shows that images of Clinton and Trump differ across a number of demographics. For example, women have less favorable views of Trump than men do, those with a college degree are more likely to view Clinton favorably, and blacks and Hispanics hold Clinton in much higher regard than they do Trump.
These patterns are not entirely the same within the LGBT population, according to combined data from June through Oct. 20, 2016. For example, among non-LGBT Americans, non-Hispanic white individuals report a substantially higher level of favorability toward Trump than their nonwhite counterparts (43% vs. 13%, respectively). But among LGBT adults, the differences by race or ethnicity are minor, with Trump being viewed favorably by just 13% of non-Hispanic whites and 11% of nonwhite adults.
LGBT support for Clinton also varies little by race or ethnicity, contrasting with the significantly stronger favorability she receives among the nonwhite, non-LGBT population. The lack of big differences in favorability by race or ethnicity among LGBT individuals can, in part, be explained by the fact that party identification doesn't differ as much between non-Hispanic white and nonwhite LGBT adults as it does for their non-LGBT counterparts. Among both white and nonwhite LGBT adults, more than 70% say they are Democrats or lean Democratic. Among non-LGBT individuals, 61% of nonwhite adults identify as Democrat, compared with only 35% of their non-Hispanic white counterparts.
| LGBT: Favorable view of Trump | LGBT: Favorable view of Clinton | Non-LGBT: Favorable view of Trump | Non-LGBT: Favorable view of Clinton | ||||||||||||||||||||||||||||||||||||||||||||||||||||||||||||||||||||||||||||||||||||||||||||||||
|---|---|---|---|---|---|---|---|---|---|---|---|---|---|---|---|---|---|---|---|---|---|---|---|---|---|---|---|---|---|---|---|---|---|---|---|---|---|---|---|---|---|---|---|---|---|---|---|---|---|---|---|---|---|---|---|---|---|---|---|---|---|---|---|---|---|---|---|---|---|---|---|---|---|---|---|---|---|---|---|---|---|---|---|---|---|---|---|---|---|---|---|---|---|---|---|---|---|---|---|
| % | % | % | % | ||||||||||||||||||||||||||||||||||||||||||||||||||||||||||||||||||||||||||||||||||||||||||||||||
| Male | 16 | 56 | 39 | 33 | |||||||||||||||||||||||||||||||||||||||||||||||||||||||||||||||||||||||||||||||||||||||||||||||
| Female | 9 | 55 | 28 | 45 | |||||||||||||||||||||||||||||||||||||||||||||||||||||||||||||||||||||||||||||||||||||||||||||||
| White | 13 | 54 | 43 | 29 | |||||||||||||||||||||||||||||||||||||||||||||||||||||||||||||||||||||||||||||||||||||||||||||||
| Nonwhite | 11 | 57 | 13 | 62 | |||||||||||||||||||||||||||||||||||||||||||||||||||||||||||||||||||||||||||||||||||||||||||||||
| Gallup, Oct 1-20 | |||||||||||||||||||||||||||||||||||||||||||||||||||||||||||||||||||||||||||||||||||||||||||||||||||
While Trump has better favorability among men than women overall, the gender gap in favorability is particularly striking in the LGBT population, as LGBT men are nearly twice as likely as LGBT women to have a favorable view of Trump (16% vs. 9%, respectively). Among non-LGBT adults, 39% of men and 28% of women view Trump favorably.
Clinton's image is least positive among young adults (those aged 18 to 34) for both LGBT and non-LGBT adults. Forty-six percent of LGBT young adults view her favorably, compared with 36% of non-LGBT Americans in this age group. Trump's favorability is highest among those aged 55 and older, regardless of LGBT identity. Slightly more than one in five LGBT adults aged 55 and older (21%) have a favorable view of Trump, compared with 41% of non-LGBT adults in this age range.
| LGBT: Favorable view of Trump | LGBT: Favorable view of Clinton | Non-LGBT: Favorable view of Trump | Non-LGBT: Favorable view of Clinton | ||||||||||||||||||||||||||||||||||||||||||||||||||||||||||||||||||||||||||||||||||||||||||||||||
|---|---|---|---|---|---|---|---|---|---|---|---|---|---|---|---|---|---|---|---|---|---|---|---|---|---|---|---|---|---|---|---|---|---|---|---|---|---|---|---|---|---|---|---|---|---|---|---|---|---|---|---|---|---|---|---|---|---|---|---|---|---|---|---|---|---|---|---|---|---|---|---|---|---|---|---|---|---|---|---|---|---|---|---|---|---|---|---|---|---|---|---|---|---|---|---|---|---|---|---|
| % | % | % | % | ||||||||||||||||||||||||||||||||||||||||||||||||||||||||||||||||||||||||||||||||||||||||||||||||
| 18-34 | 10 | 46 | 23 | 36 | |||||||||||||||||||||||||||||||||||||||||||||||||||||||||||||||||||||||||||||||||||||||||||||||
| 35-54 | 12 | 65 | 34 | 40 | |||||||||||||||||||||||||||||||||||||||||||||||||||||||||||||||||||||||||||||||||||||||||||||||
| 55+ | 21 | 68 | 41 | 41 | |||||||||||||||||||||||||||||||||||||||||||||||||||||||||||||||||||||||||||||||||||||||||||||||
| Republican/Lean | 51 | 19 | 67 | 8 | |||||||||||||||||||||||||||||||||||||||||||||||||||||||||||||||||||||||||||||||||||||||||||||||
| Independent | 14 | 20 | 17 | 26 | |||||||||||||||||||||||||||||||||||||||||||||||||||||||||||||||||||||||||||||||||||||||||||||||
| Democrat/Lean | 4 | 69 | 6 | 73 | |||||||||||||||||||||||||||||||||||||||||||||||||||||||||||||||||||||||||||||||||||||||||||||||
| Gallup, Oct 1-20 | |||||||||||||||||||||||||||||||||||||||||||||||||||||||||||||||||||||||||||||||||||||||||||||||||||
While 15% of LGBT adults in the Gallup data identify as Republican or lean Republican, LGBT Republicans report less favorable views of Trump and more favorable views of Clinton compared with non-LGBT Republicans. Barely more than half of LGBT Republicans (51%) have a favorable view of Trump, compared with 67% of non-LGBT Republicans. Among Republicans, 19% of LGBT adults have a favorable view of Clinton, compared with just 8% of their non-LGBT counterparts. Among independents and Democrats, patterns of candidate favorability do not differ much by LGBT identity.
Bottom Line
While Trump has attempted to position himself as more receptive to LGBT issues than previous Republican nominees, the Republican Party's platform still opposes marriage equality, bathroom choice for transgender individuals and parenting rights for same-sex couples. In contrast, Clinton supports marriage equality and wants to pass a federal law that would prohibit discrimination based on sexual orientation and gender identity.
To the extent that favorable views of presidential candidates translate to votes, it appears the LGBT community leans strongly toward Clinton. However, the patterns of support among various constituencies are not entirely consistent among LGBT and non-LGBT adults. Notably, race and ethnicity do not appear to be a factor in gauging support for either candidate among LGBT individuals.
Analyses of 2012 voting patterns suggest that without the support of the 5% of voters in four key swing states who identified as LGBT, President Barack Obama may have lost those states, jeopardizing his re-election. Current polling shows Clinton faring much better against Trump at this point in the election cycle compared with Obama's position relative to Romney. The closer the popular vote, the more likely it is for the LGBT community and other small voting blocs in swing states to have a clear effect on the election results. Assuming that favorability translates into votes, Gallup polling on the images of the two candidates suggests that Clinton, similar to Obama, will garner the lion's share of LGBT support. But unless the race tightens, it's unlikely that LGBT support will play a decisive role in determining the next president.
Survey Methods
Results for the most recent candidate favorable ratings are based on telephone interviews conducted June 1-Oct. 20, 2016, on the Gallup U.S. Daily survey, with a random sample of 69,075 adults, aged 18 and older, living in all 50 U.S. states and the District of Columbia. Of this group, 2,220 respondents identified as lesbian, gay, bisexual or transgender. For results based on the non-LGBT sample of national adults, the margin of sampling error is ±0.5 percentage points at the 95% confidence level. For LGBT adults, the comparable margin of error is ±2 percentage points at the 95% confidence level. Margins of error within subpopulations of both groups are higher and vary depending on sample size. All reported margins of sampling error include computed design effects for weighting.
Each sample of national adults includes a minimum quota of 60% cellphone respondents and 40% landline respondents, with additional minimum quotas by time zone within region. Landline and cellular telephone numbers are selected using random-digit-dial methods.