Story Highlights
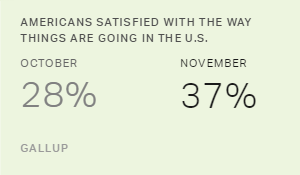
- 37% of Americans satisfied with way things are going in U.S.
- Up from 28% in October
- Low satisfaction usually associated with incumbent party losing
PRINCETON, N.J. -- On this Election Day, 37% of Americans say they are satisfied with the way things are going in the country. That is up significantly from 28% in October and now matches the historical average since Gallup first asked the question in 1979. It also ties the average figure in Gallup's final pre-election polls in prior presidential election years.
| Satisfied | Incumbent party | Winning party | |||||||||||||||||||||||||||||||||||||||||||||||||||||||||||||||||||||||||||||||||||||||||||||||||
|---|---|---|---|---|---|---|---|---|---|---|---|---|---|---|---|---|---|---|---|---|---|---|---|---|---|---|---|---|---|---|---|---|---|---|---|---|---|---|---|---|---|---|---|---|---|---|---|---|---|---|---|---|---|---|---|---|---|---|---|---|---|---|---|---|---|---|---|---|---|---|---|---|---|---|---|---|---|---|---|---|---|---|---|---|---|---|---|---|---|---|---|---|---|---|---|---|---|---|---|
| % | |||||||||||||||||||||||||||||||||||||||||||||||||||||||||||||||||||||||||||||||||||||||||||||||||||
| 2016 Nov 1-6 | 37 | Democrat | |||||||||||||||||||||||||||||||||||||||||||||||||||||||||||||||||||||||||||||||||||||||||||||||||
| 2012 Nov 1-4 | 33 | Democrat | Democrat | ||||||||||||||||||||||||||||||||||||||||||||||||||||||||||||||||||||||||||||||||||||||||||||||||
| 2008 Oct 31-Nov 2 | 13 | Republican | Democrat | ||||||||||||||||||||||||||||||||||||||||||||||||||||||||||||||||||||||||||||||||||||||||||||||||
| 2004 Oct 29-31 | 44 | Republican | Republican | ||||||||||||||||||||||||||||||||||||||||||||||||||||||||||||||||||||||||||||||||||||||||||||||||
| 2000 Oct 6-9 | 62 | Democrat | Republican | ||||||||||||||||||||||||||||||||||||||||||||||||||||||||||||||||||||||||||||||||||||||||||||||||
| 1996 Oct 26-29 | 39 | Democrat | Democrat | ||||||||||||||||||||||||||||||||||||||||||||||||||||||||||||||||||||||||||||||||||||||||||||||||
| 1992 Aug 28-Sep 2 | 22 | Republican | Democrat | ||||||||||||||||||||||||||||||||||||||||||||||||||||||||||||||||||||||||||||||||||||||||||||||||
| 1988 Sep 25-Oct 1 | 56 | Republican | Republican | ||||||||||||||||||||||||||||||||||||||||||||||||||||||||||||||||||||||||||||||||||||||||||||||||
| 1984 Sep 28-Oct 1 | 48 | Republican | Republican | ||||||||||||||||||||||||||||||||||||||||||||||||||||||||||||||||||||||||||||||||||||||||||||||||
| 1979 Nov 2-5 | 19 | Democrat | Republican | ||||||||||||||||||||||||||||||||||||||||||||||||||||||||||||||||||||||||||||||||||||||||||||||||
| Note: No satisfaction measures were taken in 1980, but satisfaction was 19% in November 1979 and 17% in January 1981, indicating it was likely similar in 1980. | |||||||||||||||||||||||||||||||||||||||||||||||||||||||||||||||||||||||||||||||||||||||||||||||||||
| Gallup | |||||||||||||||||||||||||||||||||||||||||||||||||||||||||||||||||||||||||||||||||||||||||||||||||||
The current results are based on a Nov. 1-6 Gallup poll. Low satisfaction can be an indicator that Americans are ready to change the government as a means of trying to improve the situation in the country. Consistent with that pattern, the incumbent party lost the 1980, 1992 and 2008 campaigns, all election cycles in which U.S. satisfaction was no greater than 22%.
However, the incumbent party has won elections when satisfaction was well below the majority level. In the 2012 election, Barack Obama won re-election when 33% of Americans were satisfied. In 1996, Bill Clinton won re-election when 39% were satisfied. Both presidents may have benefited from satisfaction being significantly higher than it was four years earlier when each was elected. George W. Bush won re-election when 44% of Americans were satisfied in 2004, even though satisfaction was lower at that time than it was when Bush was first elected in 2000.
Therefore, by no means is majority satisfaction necessary for the incumbent party to win a presidential election. Rather, satisfaction near the historical average of 37% may be enough, as it was in 1996 and 2012.
However, above-average satisfaction does not guarantee a favorable outcome for the incumbent party. The major exception occurred in 2000 when 62% of Americans were satisfied -- the highest it has been at the time of a presidential election in Gallup's trend. That year, Democrat Al Gore won the popular vote, but Republican George W. Bush won the presidency in the Electoral College after the Supreme Court sided with Bush in a legal dispute over the Florida results.
In contrast, George H.W. Bush was elected president in 1988 to succeed Ronald Reagan at a time when 56% of Americans were satisfied with the state of the nation.
Satisfaction Up Among All Major Political Groups Since October
The current 37% satisfaction figure is the highest in President Obama's time in office by one percentage point over a reading in August 2009, during his first year in office. The last time satisfaction was higher was in September 2005, when it was 39%.
Americans from all three major political party groups are more satisfied now than they were one month ago. Democrats' satisfaction has increased the most -- 13 percentage points -- to 62%. Independents (34%) and Republicans (14%) are much less satisfied than Democrats, which is to be expected with a Democratic president in office, but both have shown meaningful gains in satisfaction in the past month.
| Oct 5-9, 2016 | Nov 1-6, 2016 | Change | |||||||||||||||||||||||||||||||||||||||||||||||||||||||||||||||||||||||||||||||||||||||||||||||||
|---|---|---|---|---|---|---|---|---|---|---|---|---|---|---|---|---|---|---|---|---|---|---|---|---|---|---|---|---|---|---|---|---|---|---|---|---|---|---|---|---|---|---|---|---|---|---|---|---|---|---|---|---|---|---|---|---|---|---|---|---|---|---|---|---|---|---|---|---|---|---|---|---|---|---|---|---|---|---|---|---|---|---|---|---|---|---|---|---|---|---|---|---|---|---|---|---|---|---|---|
| % | % | pct. pts. | |||||||||||||||||||||||||||||||||||||||||||||||||||||||||||||||||||||||||||||||||||||||||||||||||
| National adults | 28 | 37 | +9 | ||||||||||||||||||||||||||||||||||||||||||||||||||||||||||||||||||||||||||||||||||||||||||||||||
| Democrats | 49 | 62 | +13 | ||||||||||||||||||||||||||||||||||||||||||||||||||||||||||||||||||||||||||||||||||||||||||||||||
| Independents | 24 | 34 | +10 | ||||||||||||||||||||||||||||||||||||||||||||||||||||||||||||||||||||||||||||||||||||||||||||||||
| Republicans | 8 | 14 | +6 | ||||||||||||||||||||||||||||||||||||||||||||||||||||||||||||||||||||||||||||||||||||||||||||||||
| Gallup | |||||||||||||||||||||||||||||||||||||||||||||||||||||||||||||||||||||||||||||||||||||||||||||||||||
In each of the past four presidential election years, Gallup has measured increases in satisfaction from early October to right before the election. This included three-percentage-point gains in 2004 and 2012, a six-point gain in 2008 and a nine-point gain this year. Thus, something about the approaching election -- either satisfaction with the democratic process or optimism about the prospect of their preferred candidate winning -- may make Americans feel modestly better about the way things are going in the country.
Implications
The surge in satisfaction right before the election is a promising sign for Democratic presidential candidate Hillary Clinton as she attempts to succeed a Democratic president in office. Another positive sign for the Clinton campaign is that satisfaction is well above the levels associated with the levels when incumbent parties were defeated in 1980, 1992 and 2008. At least two incumbent presidents, Obama in 2012 and Bill Clinton in 1996, have been re-elected when satisfaction was similar to what it is now.
There have been only three prior presidential elections that did not involve an incumbent president in the years in which Gallup has asked the satisfaction question. The link between satisfaction and the election outcome is not clear-cut in those cases, with the incumbent party winning in 1988 when satisfaction was above average, losing in 2000 when satisfaction was above average, and losing in 2008 when satisfaction was well below average.
In non-incumbent presidential elections, voters' evaluations of the candidates' characteristics, assessments of the candidates' ideology and policy positions, and party leanings may matter more than assessments of how the nation is doing when they decide which candidate to vote for.
Historical data are available in Gallup Analytics.
Survey Methods
Results for this Gallup poll are based on telephone interviews conducted Nov. 1-6, 2016, with a random sample of 1,532 adults, aged 18 and older, living in all 50 U.S. states and the District of Columbia. For results based on the total sample of national adults, the margin of sampling error is ±3 percentage points at the 95% confidence level. All reported margins of sampling error include computed design effects for weighting.
Each sample of national adults includes a minimum quota of 60% cellphone respondents and 40% landline respondents, with additional minimum quotas by time zone within region. Landline and cellular telephone numbers are selected using random-digit-dial methods.
View survey methodology, complete question responses and trends.
Learn more about how the Gallup Poll Social Series works.