Story Highlights
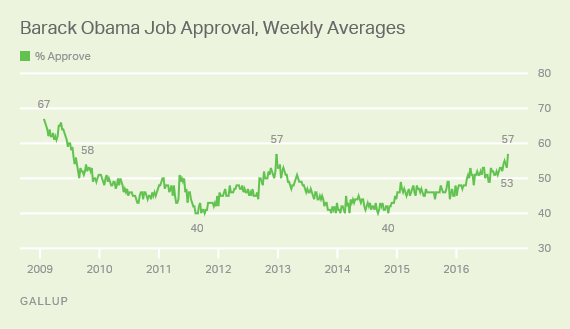
- President Obama's job approval rating for week ending Nov. 13 is 57%
- Since 2009, only other average that high was 57% in December 2012
- Obama's favorable rating, 62%, also higher than at any time since 2009
PRINCETON, N.J. -- President Barack Obama's job approval rating rose to 57% last week, his highest weekly average since late December 2012. Prior to 2012, Obama's weekly approval rating had not reached 57% since July 2009.

Last week's uptick in Obama's approval rating continues a broader trend in Americans' more positive evaluations of his job performance this year. Job approval for his 31st quarter in office, which ended Oct. 19, was the best quarterly average in his second term and ties as the fourth best of his presidency.
The improvement in Obama's approval rating also reflects the "post-election bounce" that lame duck presidents typically have enjoyed in November of their last year in office.
George H.W. Bush, who lost his bid for re-election in 1992, saw his approval rating rise nine percentage points after the election, the biggest such increase of the five most recent presidents. The other four presidents served two full terms and were not up for re-election, and saw post-election increases ranging from three to six points. Obama's four-point uptick this past week is within the range of what would be expected based on these previous trends.
| Year | Dates of interviewing | Approval rating | |||||||||||||||||||||||||||||||||||||||||||||||||||||||||||||||||||||||||||||||||||||||||||||||||
|---|---|---|---|---|---|---|---|---|---|---|---|---|---|---|---|---|---|---|---|---|---|---|---|---|---|---|---|---|---|---|---|---|---|---|---|---|---|---|---|---|---|---|---|---|---|---|---|---|---|---|---|---|---|---|---|---|---|---|---|---|---|---|---|---|---|---|---|---|---|---|---|---|---|---|---|---|---|---|---|---|---|---|---|---|---|---|---|---|---|---|---|---|---|---|---|---|---|---|---|
| Barack Obama | 2016 | Nov 7-13 | 57% | ||||||||||||||||||||||||||||||||||||||||||||||||||||||||||||||||||||||||||||||||||||||||||||||||
| 2016 | Oct 31-Nov 6 | 53% | |||||||||||||||||||||||||||||||||||||||||||||||||||||||||||||||||||||||||||||||||||||||||||||||||
| Change | +4 | ||||||||||||||||||||||||||||||||||||||||||||||||||||||||||||||||||||||||||||||||||||||||||||||||||
| George W. Bush | 2008 | Nov 7-9 | 28% | ||||||||||||||||||||||||||||||||||||||||||||||||||||||||||||||||||||||||||||||||||||||||||||||||
| 2008 | Oct 31-Nov 2 | 25% | |||||||||||||||||||||||||||||||||||||||||||||||||||||||||||||||||||||||||||||||||||||||||||||||||
| Change | +3 | ||||||||||||||||||||||||||||||||||||||||||||||||||||||||||||||||||||||||||||||||||||||||||||||||||
| Bill Clinton | 2000 | Nov 13-15 | 63% | ||||||||||||||||||||||||||||||||||||||||||||||||||||||||||||||||||||||||||||||||||||||||||||||||
| 2000 | Oct 25-28 | 57% | |||||||||||||||||||||||||||||||||||||||||||||||||||||||||||||||||||||||||||||||||||||||||||||||||
| Change | +6 | ||||||||||||||||||||||||||||||||||||||||||||||||||||||||||||||||||||||||||||||||||||||||||||||||||
| George H.W. Bush | 1992 | Nov 20-22 | 43% | ||||||||||||||||||||||||||||||||||||||||||||||||||||||||||||||||||||||||||||||||||||||||||||||||
| 1992 | Oct 13-15 | 34% | |||||||||||||||||||||||||||||||||||||||||||||||||||||||||||||||||||||||||||||||||||||||||||||||||
| Change | +9 | ||||||||||||||||||||||||||||||||||||||||||||||||||||||||||||||||||||||||||||||||||||||||||||||||||
| Ronald Reagan | 1988 | Nov 11-14 | 57% | ||||||||||||||||||||||||||||||||||||||||||||||||||||||||||||||||||||||||||||||||||||||||||||||||
| 1988 | Oct 21-24 | 51% | |||||||||||||||||||||||||||||||||||||||||||||||||||||||||||||||||||||||||||||||||||||||||||||||||
| Change | +6 | ||||||||||||||||||||||||||||||||||||||||||||||||||||||||||||||||||||||||||||||||||||||||||||||||||
| Gallup | |||||||||||||||||||||||||||||||||||||||||||||||||||||||||||||||||||||||||||||||||||||||||||||||||||
Obama's Favorable Rating, Approval on the Economy Also Up
In a Gallup Nov. 9-13 survey, 62% of Americans say they have a favorable opinion of Obama, while 37% hold an unfavorable opinion. This compares with a 54% favorable and 43% unfavorable reading when Gallup last updated this measure in August.
Gallup has measured Obama's favorable rating 47 times since he first took office, and his current 62% is his highest since July 2009. His lowest favorable rating was 42% in November 2014.
Gallup also measured the public's approval of Obama's handling of key issues in the most recent survey. Half of Americans say they approve of the way he is handling the economy, slightly higher than in August and reaching the 50% level for the first time since May 2009. Obama's job approval ratings on handling foreign affairs and healthcare policy are 47% and 41%, respectively, and are essentially unchanged from previous measurements.
Bottom Line
The increase in Obama's job approval rating this past week continues a gradual improvement seen most of the year, and reflects the typical post-election bump that most lame duck presidents enjoy toward the end of their time in the White House. It is possible that Obama's approval rating could rise further. George H.W. Bush's approval reached 56% in January 1993 just before he left office, up 23 points from October of the previous year. Ronald Reagan's rose to 63% in his last measure, recorded in December 1988, from 51% that October.
These data are available in Gallup Analytics.
Survey Methods
Results for this Gallup poll are based on telephone interviews conducted Nov. 7-13, 2016, on the Gallup U.S. Daily survey, with a random sample of 3,561 adults, aged 18 and older, living in all 50 U.S. states and the District of Columbia. For results based on this total sample of national adults, the margin of sampling error is ±2 percentage points at the 95% confidence level. Results are also based on telephone interviews conducted Nov. 9-13, 2016, with a random sample of 1,019 adults. For this sample, the margin of sampling error is ±4 percentage points at the 95% confidence level. All reported margins of sampling error include computed design effects for weighting.
Each sample of national adults includes a minimum quota of 60% cellphone respondents and 40% landline respondents, with additional minimum quotas by time zone within region. Landline and cellular telephone numbers are selected using random-digit-dial methods.
View complete question responses and trends.
Learn more about how the Gallup U.S. Daily works.


