Story Highlights
- 27% of Americans satisfied in December with the way things are going in U.S.
- 2016 average of 27% is similar to 2012-2015 combined average of 25%
- Republicans' satisfaction improving, Democrats' worsening since election
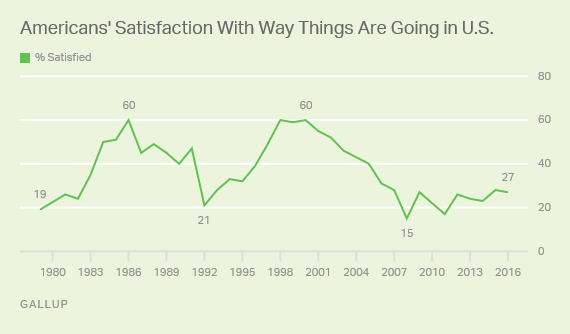
WASHINGTON, D.C. -- In 2016, an average of 27% of Americans have been satisfied with the way things are going in the U.S. This is comparable to averages since 2012 but is lower than the 37% yearly average over the 37 years Gallup has tracked this measure.

Satisfaction in 2016 Resembles Recent Years but Is Historically Low
In the past decade, the U.S. has faced a range of domestic and international challenges including the Iraq War, the global financial crisis, several high-profile mass shootings, increased racial tensions and partisan gridlock in the federal government -- all of which could have negatively affected Americans' perceptions of the way things were going in the country.
This year's average satisfaction is similar to the combined average of 25% from 2012-2015 and is slightly higher than the 22% combined average from 2007-2011. The latter period included record-low yearly averages of 15% in 2008 and 17% in 2011.
In the recent trend, 2006 was a transitional year; satisfaction dropped nine percentage points from the previous year, coinciding with Americans' decreasing approval of then-President George W. Bush and an increase in their belief that the Iraq War was a mistake. Lower satisfaction levels in 2006 likely contributed to the Democrats taking control of the House of Representatives for the first time in 12 years. Before 2006, the yearly average satisfaction level for the previous 26 years measured was 42%.
Overall Satisfaction in December Equals Immediate Post-Election Level
In December polling, 27% of Americans are satisfied with the way things are going in the U.S. This matches the November reading taken just after the election. Americans' satisfaction levels each month of this year mostly remained near the annual average. Two exceptions were in July (17%) when the killings of police officers in Dallas and the fatal shootings of black men in Minnesota and Louisiana dominated headlines, and in the first week of November when 37% of the country was satisfied heading into the election.
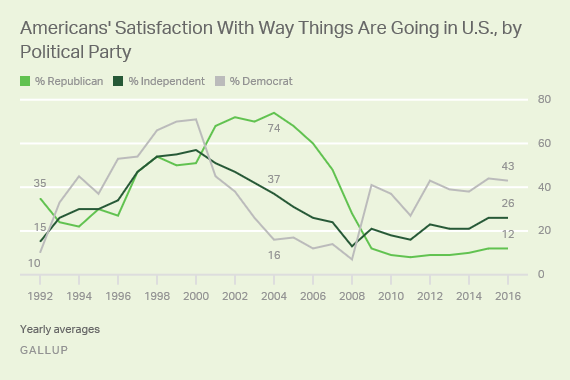
The lack of overall change in December masks some shifts among partisan groups. Twenty-four percent of Republicans in December are satisfied with the way things are going in the U.S., up from 17% last month. While still low overall, it is Republicans' highest satisfaction level since right before the 2008 presidential election, which ended eight years of Republican leadership in the White House. Republicans' anticipation of President-elect Donald Trump's transition has likely boosted their satisfaction with the nation's direction.
While Republicans' satisfaction has increased, Democrats' satisfaction continues to head in the opposite direction. Thirty percent of Democrats are satisfied in December, slightly below the 34% satisfied just after the election. Both figures are down dramatically from a poll conducted shortly before Election Day when 62% of Democrats were satisfied with the way things were going in the country. The popular belief that Hillary Clinton would win the election may have influenced Democrats' higher satisfaction at that time. Democrats' satisfaction surged similarly just before Barack Obama's victory in the 2012 election.
Although Democrats' satisfaction levels have dipped recently, their 2016 average (43%) is still higher than that of Republicans (12%). Party affiliation has served as a good indicator of satisfaction since Gallup began tracking satisfaction level by political party in 1992, as those who align with the president's party have, on average, been more satisfied than have those who do not.

Bottom Line
While Americans have not been as satisfied in 2016 as they were in much of the 1980s and 1990s, they have been about as satisfied as they were throughout Obama's presidency and in the final years of Bush's presidency. Several factors typically influence Americans' satisfaction with the way things are going in the country, including the economy and the status of any foreign entanglements in which the U.S. is involved.
With the political divisions existent in this year's election, Americans may feel less satisfied when asked about the state of the country. But this year, Americans appear to feel no worse about the country than they have in the past few years -- though still far from as satisfied as they could be.
Survey Methods
Results are based on telephone interviews conducted Dec. 7-11, 2016, with a random sample of 1,028 adults, aged 18+, living in all 50 U.S. states and the District of Columbia. For results based on this sample of national adults, the margin of sampling error is ±4 percentage points at the 95% confidence level. All reported margins of sampling error include computed design effects for weighting.
Each sample of national adults includes a minimum quota of 60% cellphone respondents and 40% landline respondents, with additional minimum quotas by time zone within region. Landline and cellular telephone numbers are selected using random-digit-dial methods.
View survey methodology, complete question responses and trends.
Learn more about how the Gallup Poll Social Series works.


