Story Highlights
- 48% say U.S. will be better off; 46% say worse off
- More people said U.S. would be better off before 2009 inauguration
- 85% of Republicans, 14% of Democrats say U.S. will be better off
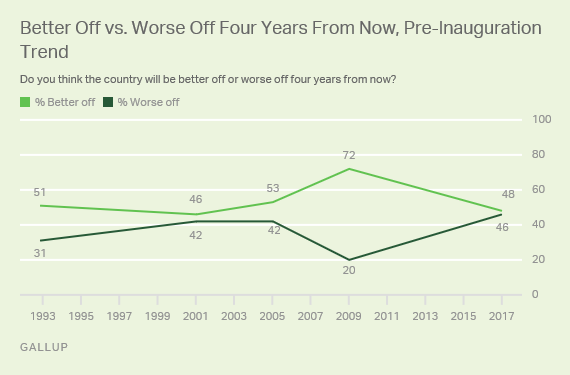
WASHINGTON, D.C. -- Just before Donald Trump took office, Americans were evenly divided as to whether the nation will be better off or worse off four years from now. Forty-eight percent said the country will be better off in 2020, while 46% said the U.S. will be worse off. Optimism is sharply lower than it was just before Barack Obama's first inauguration in January 2009, when 72% said the nation would be better off in four years.

The split between better off and worse off closely mirrors the sentiment in 2001 as George W. Bush was preparing to take office. Like Trump, Bush narrowly defeated his opponent, Al Gore, in the Electoral College but lost the popular vote. In the January 2001 poll, 46% of Americans said they thought the country would be better off in four years, and 42% said they thought it would be worse off. Slightly more were optimistic at the dawn of President Bush's second term, when 53% said the country would be better off and 42% said worse off.
When Gallup first asked this question just before Bill Clinton took office in 1992, 51% said the nation would be better off in four years, while 31% believed it would be worse off.
Stark Partisan Divide in Predictions for Nation's Future
In the latest survey, conducted Jan. 4-8, 85% of Republicans believe the U.S. will be better off four years from now, while only 14% of Democrats feel the same. Independents' views are similar to the national sentiment, with 44% believing the country will be better off and 48% worse off.
The GOP reading is similar to the last two times a Republican president was inaugurated, in 2001 and 2005. Republicans were much less optimistic when Barack Obama was on the verge of becoming president in 2009 -- 52% said the nation would be better off. Still, that figure was significantly higher than the typical rating partisans give when a president from the opposite party is coming into office.
| Republican | Independent | Democrat | ||||||||||||||||||||||||||||||||||||||||||||||||||||||||||||||||||||||||||||||||||||||||||||||||||
|---|---|---|---|---|---|---|---|---|---|---|---|---|---|---|---|---|---|---|---|---|---|---|---|---|---|---|---|---|---|---|---|---|---|---|---|---|---|---|---|---|---|---|---|---|---|---|---|---|---|---|---|---|---|---|---|---|---|---|---|---|---|---|---|---|---|---|---|---|---|---|---|---|---|---|---|---|---|---|---|---|---|---|---|---|---|---|---|---|---|---|---|---|---|---|---|---|---|---|---|---|
| % | % | % | ||||||||||||||||||||||||||||||||||||||||||||||||||||||||||||||||||||||||||||||||||||||||||||||||||
| 2017 | ||||||||||||||||||||||||||||||||||||||||||||||||||||||||||||||||||||||||||||||||||||||||||||||||||||
| Better Off | 85 | 44 | 14 | |||||||||||||||||||||||||||||||||||||||||||||||||||||||||||||||||||||||||||||||||||||||||||||||||
| Worse Off | 11 | 48 | 79 | |||||||||||||||||||||||||||||||||||||||||||||||||||||||||||||||||||||||||||||||||||||||||||||||||
| 2009 | ||||||||||||||||||||||||||||||||||||||||||||||||||||||||||||||||||||||||||||||||||||||||||||||||||||
| Better Off | 52 | 67 | 92 | |||||||||||||||||||||||||||||||||||||||||||||||||||||||||||||||||||||||||||||||||||||||||||||||||
| Worse Off | 35 | 22 | 5 | |||||||||||||||||||||||||||||||||||||||||||||||||||||||||||||||||||||||||||||||||||||||||||||||||
| 2005 | ||||||||||||||||||||||||||||||||||||||||||||||||||||||||||||||||||||||||||||||||||||||||||||||||||||
| Better Off | 87 | 41 | 31 | |||||||||||||||||||||||||||||||||||||||||||||||||||||||||||||||||||||||||||||||||||||||||||||||||
| Worse Off | 9 | 53 | 65 | |||||||||||||||||||||||||||||||||||||||||||||||||||||||||||||||||||||||||||||||||||||||||||||||||
| 2001 | ||||||||||||||||||||||||||||||||||||||||||||||||||||||||||||||||||||||||||||||||||||||||||||||||||||
| Better Off | 81 | 40 | 19 | |||||||||||||||||||||||||||||||||||||||||||||||||||||||||||||||||||||||||||||||||||||||||||||||||
| Worse Off | 8 | 41 | 75 | |||||||||||||||||||||||||||||||||||||||||||||||||||||||||||||||||||||||||||||||||||||||||||||||||
| 1992 | ||||||||||||||||||||||||||||||||||||||||||||||||||||||||||||||||||||||||||||||||||||||||||||||||||||
| Better Off | 22 | 48 | 74 | |||||||||||||||||||||||||||||||||||||||||||||||||||||||||||||||||||||||||||||||||||||||||||||||||
| Worse Off | 58 | 34 | 10 | |||||||||||||||||||||||||||||||||||||||||||||||||||||||||||||||||||||||||||||||||||||||||||||||||
| Gallup | ||||||||||||||||||||||||||||||||||||||||||||||||||||||||||||||||||||||||||||||||||||||||||||||||||||
Democrats, in contrast, have generally believed the nation would be worse off when a Republican president was about to take office. The highest percentage of Democrats who said the nation would be better off when a Republican was entering office was 31% in 2005, when Bush was preparing to begin his second term.
Bottom Line
Presidents are often evaluated based on whether Americans think they are better off than they were four years ago, a phrase popularized by Ronald Reagan in his singular presidential debate with Jimmy Carter in 1980. The idea of being better off in the future may imply that the nation needs to recover from something. In 2009, the 72% who said the country would be better off four years from now may have been reacting to the Great Recession, which was in full effect. In short, there was nowhere to go but up. In 2001, the country was near the end of roughly 10 years of economic growth, and Americans may not have thought there was much room for the country to improve.
Of course, Americans may simply be thinking of whom the new or returning president will be and what he will accomplish. In 1993, 2005 and 2009, the incoming president had decisively beat his opponent, and was enjoying relatively high popularity nationwide. The same cannot be said for President Trump, who is experiencing less than 50% approval as he begins his tenure.
Historical data are available in Gallup Analytics.
Survey Methods
Results for this Gallup poll are based on telephone interviews conducted Jan. 4-8, 2017, with a random sample of 1,032 adults, aged 18 and older, living in all 50 U.S. states and the District of Columbia. For results based on the total sample of national adults, the margin of sampling error is ±4 percentage points at the 95% confidence level. All reported margins of sampling error include computed design effects for weighting.
Each sample of national adults includes a minimum quota of 70% cellphone respondents and 30% landline respondents, with additional minimum quotas by time zone within region. Landline and cellular telephone numbers are selected using random-digit-dial methods.
View survey methodology, complete question responses and trends.
Learn more about how the Gallup Poll Social Series works.


