Story Highlights
- 44% view Democratic Party favorably; 36% rate GOP positively
- Democratic advantage matches post-convention reading in August 2016
- Independents rate Democratic Party more positively than GOP
This story is part of a series focusing on Americans' confidence in various types of government and their views of the political parties and of the role and power of government. Follow the series on our Government topic page.
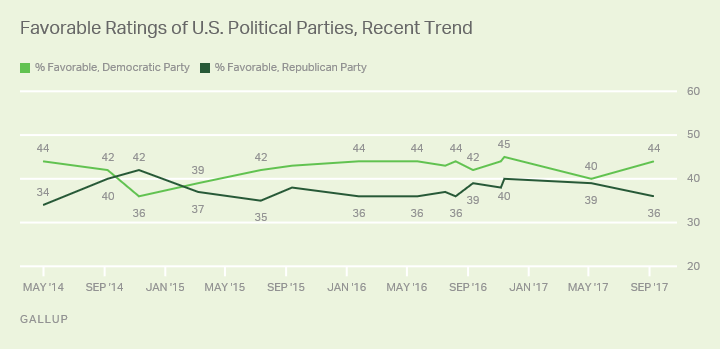
WASHINGTON, D.C. -- Americans again rate the Democratic Party (44%) more positively than the Republican Party (36%). This is a shift since May, when the parties were essentially tied. However, Democrats have held an edge in favorable ratings for most of the past three years.

The latest results are from Gallup's annual Governance poll, conducted Sept. 6-10. Democrats' eight-percentage-point advantage in favorability matches the party gap for much of 2016, from January until August -- shortly after the July 25-28 Democratic National Convention. In September 2016, during the fall presidential campaign, the party's edge slipped to three points, and averaged four points from then until the current reading.
Americans usually rate the Democratic Party better than the Republican Party. One recent exception was November 2014, after Republicans exceeded expectations by winning control of the U.S. Senate in the midterm elections. The 36% favorable rating of the Democratic Party in that survey is the lowest Gallup has measured. The record-low Republican favorable rating was 28% in October 2013, during the GOP-led partial government shutdown.

Gallup Analytics
Subscribe to our online platform and access nearly a century of primary data.
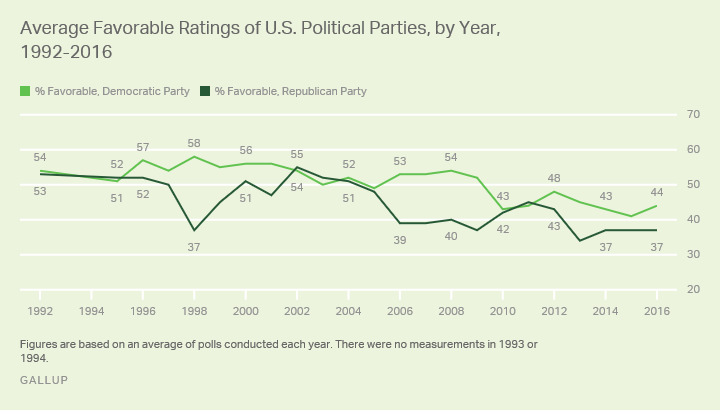
While both parties' current favorable ratings are comfortably above their record lows, they remain below historical norms. Gallup first assessed Americans' opinions of the major U.S. political parties using this question format in 1992. Since then, an average of 51% of Americans have rated the Democratic Party favorably, and an average of 44% have done the same for Republicans.
Although both parties are rated worse than usual, the Democratic Party's current eight-point advantage is in line with the historical average party gap of seven points. The Democratic Party has at times enjoyed significantly larger leads over the Republican Party -- including in 1998, when President Bill Clinton was impeached, and in 2006 through 2008, the final years of George W. Bush's presidency.

Democrats Fuel Rise in Ratings of Democratic Party
The changes in party ratings since May are largely a function of higher ratings of the Democratic Party among Democrats and lower ratings of the Republican Party among independents. Democrats' favorable rating of their own party has increased from 77% to 89% over the past four months. There has been little to no change in independents' and Republicans' ratings of the Democratic Party.
Meanwhile, Republicans' and Democrats' ratings of the GOP have been stable since May. The overall decline in GOP favorability ratings is largely because independents are less positive toward the party.
| May 2017 | September 2017 | Change | ||||||||||||||||||||||||||||||||||||||||||||||||||||||||||||||||||||||||||||||||||||||||||||||||||
|---|---|---|---|---|---|---|---|---|---|---|---|---|---|---|---|---|---|---|---|---|---|---|---|---|---|---|---|---|---|---|---|---|---|---|---|---|---|---|---|---|---|---|---|---|---|---|---|---|---|---|---|---|---|---|---|---|---|---|---|---|---|---|---|---|---|---|---|---|---|---|---|---|---|---|---|---|---|---|---|---|---|---|---|---|---|---|---|---|---|---|---|---|---|---|---|---|---|---|---|---|
| % Favorable | % Favorable | pct. pts. | ||||||||||||||||||||||||||||||||||||||||||||||||||||||||||||||||||||||||||||||||||||||||||||||||||
| Democratic Party | ||||||||||||||||||||||||||||||||||||||||||||||||||||||||||||||||||||||||||||||||||||||||||||||||||||
| U.S. adults | 40 | 44 | +4 | |||||||||||||||||||||||||||||||||||||||||||||||||||||||||||||||||||||||||||||||||||||||||||||||||
| Democrats | 77 | 89 | +12 | |||||||||||||||||||||||||||||||||||||||||||||||||||||||||||||||||||||||||||||||||||||||||||||||||
| Independents | 34 | 34 | 0 | |||||||||||||||||||||||||||||||||||||||||||||||||||||||||||||||||||||||||||||||||||||||||||||||||
| Republicans | 15 | 13 | -2 | |||||||||||||||||||||||||||||||||||||||||||||||||||||||||||||||||||||||||||||||||||||||||||||||||
| Republican Party | ||||||||||||||||||||||||||||||||||||||||||||||||||||||||||||||||||||||||||||||||||||||||||||||||||||
| U.S. adults | 39 | 36 | -3 | |||||||||||||||||||||||||||||||||||||||||||||||||||||||||||||||||||||||||||||||||||||||||||||||||
| Democrats | 9 | 8 | -1 | |||||||||||||||||||||||||||||||||||||||||||||||||||||||||||||||||||||||||||||||||||||||||||||||||
| Independents | 33 | 25 | -8 | |||||||||||||||||||||||||||||||||||||||||||||||||||||||||||||||||||||||||||||||||||||||||||||||||
| Republicans | 79 | 80 | +1 | |||||||||||||||||||||||||||||||||||||||||||||||||||||||||||||||||||||||||||||||||||||||||||||||||
| Gallup | ||||||||||||||||||||||||||||||||||||||||||||||||||||||||||||||||||||||||||||||||||||||||||||||||||||
As would be expected, party identifiers rate their own party much more positively than they rate the other party. But Democrats are currently more positive toward their own party (89% favorable) than Republicans are toward theirs (80%). And Republicans' favorable rating of the Democratic Party (13%) is slightly higher than Democrats' rating of the Republican Party (8%).
Independents' higher favorable rating of the Democratic Party (34%) than of the Republican Party (25%) means that the Democratic Party has a more positive image than the GOP among all three groups -- political independents, party supporters and party opponents.
Bottom Line
The Democratic Party has regained a significant advantage over the Republican Party in favorability in recent months, with the current edge in line with what Gallup has typically measured over the past 25 years.
Democrats' chances of having a strong 2018 election cycle will be enhanced if they go into the year with a more positive public image than Republicans have, as was the case in 2006 and 2008. If the parties are rated similarly next year, as they were this spring, Democratic leaders would have reason to be nervous, as the parties had comparable favorable ratings in several recent years when Republicans fared well in elections, including 2002, 2004 and 2010.
Survey Methods
Results for this Gallup poll are based on telephone interviews conducted Sept. 6-10, 2017, with a random sample of 1,022 adults, aged 18 and older, living in all 50 U.S. states and the District of Columbia. For results based on the total sample of national adults, the margin of sampling error is ±4 percentage points at the 95% confidence level. All reported margins of sampling error include computed design effects for weighting.
Each sample of national adults includes a minimum quota of 70% cellphone respondents and 30% landline respondents, with additional minimum quotas by time zone within region. Landline and cellular telephone numbers are selected using random-digit-dial methods.
View survey methodology, complete question responses and trends.
Learn more about how the Gallup Poll Social Series works.


