WASHINGTON, D.C. -- Nonretired Americans, on average, say they will retire at age 66. This projected age of retirement has stayed about the same in recent years, but is up from previous decades. During the 1990s, the average American projected retiring at age 60.
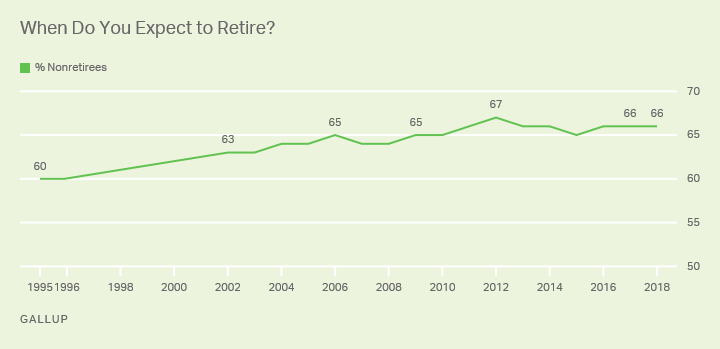
Americans' projected age of retirement has stabilized between 65 and 67 since 2009. It was slightly lower, averaging 64, between 2002 and 2008, and lower still, at 60, in two Gallup surveys conducted in 1995.
Overall, 41% of nonretirees in the April 2-11 Gallup poll plan to retire at age 66 or older, by two percentage points the highest in Gallup's trend. In surveys conducted in 2004 and prior, less than 30% wanted to wait until after age 65 to retire, including just 12% in November 1995.
Meanwhile, the percentage wanting to retire before age 60 has dropped by more than half from 27% in 1995 to 12% today.
| Under 59 | 60-64 | 65 | Over 65 | ||||||||||||||||||||||||||||||||||||||||||||||||||||||||||||||||||||||||||||||||||||||||||||||||
|---|---|---|---|---|---|---|---|---|---|---|---|---|---|---|---|---|---|---|---|---|---|---|---|---|---|---|---|---|---|---|---|---|---|---|---|---|---|---|---|---|---|---|---|---|---|---|---|---|---|---|---|---|---|---|---|---|---|---|---|---|---|---|---|---|---|---|---|---|---|---|---|---|---|---|---|---|---|---|---|---|---|---|---|---|---|---|---|---|---|---|---|---|---|---|---|---|---|---|---|
| % | % | % | % | ||||||||||||||||||||||||||||||||||||||||||||||||||||||||||||||||||||||||||||||||||||||||||||||||
| 2018 Apr 2-11 | 12 | 15 | 24 | 41 | |||||||||||||||||||||||||||||||||||||||||||||||||||||||||||||||||||||||||||||||||||||||||||||||
| 2017 Apr 5-9 | 14 | 15 | 24 | 39 | |||||||||||||||||||||||||||||||||||||||||||||||||||||||||||||||||||||||||||||||||||||||||||||||
| 2016 Apr 6-10 | 12 | 19 | 24 | 37 | |||||||||||||||||||||||||||||||||||||||||||||||||||||||||||||||||||||||||||||||||||||||||||||||
| 2015 Apr 9-12 | 14 | 18 | 24 | 37 | |||||||||||||||||||||||||||||||||||||||||||||||||||||||||||||||||||||||||||||||||||||||||||||||
| 2014 Apr 3-6 | 10 | 18 | 26 | 36 | |||||||||||||||||||||||||||||||||||||||||||||||||||||||||||||||||||||||||||||||||||||||||||||||
| 2013 Apr 4-14 | 11 | 15 | 26 | 37 | |||||||||||||||||||||||||||||||||||||||||||||||||||||||||||||||||||||||||||||||||||||||||||||||
| 2012 Apr 9-12 | 13 | 13 | 27 | 39 | |||||||||||||||||||||||||||||||||||||||||||||||||||||||||||||||||||||||||||||||||||||||||||||||
| 2011 Apr 7-11 | 11 | 17 | 25 | 37 | |||||||||||||||||||||||||||||||||||||||||||||||||||||||||||||||||||||||||||||||||||||||||||||||
| 2010 Apr 8-11 | 11 | 18 | 27 | 34 | |||||||||||||||||||||||||||||||||||||||||||||||||||||||||||||||||||||||||||||||||||||||||||||||
| 2009 Apr 6-9 | 14 | 18 | 24 | 31 | |||||||||||||||||||||||||||||||||||||||||||||||||||||||||||||||||||||||||||||||||||||||||||||||
| 2008 Apr 6-9 | 16 | 19 | 24 | 32 | |||||||||||||||||||||||||||||||||||||||||||||||||||||||||||||||||||||||||||||||||||||||||||||||
| 2007 Apr 2-5 | 17 | 18 | 27 | 30 | |||||||||||||||||||||||||||||||||||||||||||||||||||||||||||||||||||||||||||||||||||||||||||||||
| 2006 Apr 10-13 | 14 | 20 | 26 | 29 | |||||||||||||||||||||||||||||||||||||||||||||||||||||||||||||||||||||||||||||||||||||||||||||||
| 2005 Apr 4-7 | 15 | 22 | 25 | 31 | |||||||||||||||||||||||||||||||||||||||||||||||||||||||||||||||||||||||||||||||||||||||||||||||
| 2004 Apr 5-8 | 20 | 21 | 26 | 26 | |||||||||||||||||||||||||||||||||||||||||||||||||||||||||||||||||||||||||||||||||||||||||||||||
| 2003 Apr 7-9 | 19 | 23 | 28 | 22 | |||||||||||||||||||||||||||||||||||||||||||||||||||||||||||||||||||||||||||||||||||||||||||||||
| 2002 Apr 8-11 | 22 | 21 | 26 | 21 | |||||||||||||||||||||||||||||||||||||||||||||||||||||||||||||||||||||||||||||||||||||||||||||||
| 1995 Dec 15-18 | 27 | 23 | 29 | 15 | |||||||||||||||||||||||||||||||||||||||||||||||||||||||||||||||||||||||||||||||||||||||||||||||
| 1995 Nov 6-8 | 27 | 20 | 34 | 12 | |||||||||||||||||||||||||||||||||||||||||||||||||||||||||||||||||||||||||||||||||||||||||||||||
| Gallup | |||||||||||||||||||||||||||||||||||||||||||||||||||||||||||||||||||||||||||||||||||||||||||||||||||
Americans under age 30 project a significantly younger retirement age than those 30 to 64 years. This gap has been evident since 2002. Apparently, just as they are more optimistic about having enough money to be comfortable in retirement, young people are also more optimistic that they will retire at a fairly young age. But Americans appear to readjust their retirement projections upward once they cross the 30-years-of-age threshold.
| Average age expect to retire | ||||||||||||||||||||||||||||||||||||||||||||||||||||||||||||||||||||||||||||||||||||||||||||||||||||
|---|---|---|---|---|---|---|---|---|---|---|---|---|---|---|---|---|---|---|---|---|---|---|---|---|---|---|---|---|---|---|---|---|---|---|---|---|---|---|---|---|---|---|---|---|---|---|---|---|---|---|---|---|---|---|---|---|---|---|---|---|---|---|---|---|---|---|---|---|---|---|---|---|---|---|---|---|---|---|---|---|---|---|---|---|---|---|---|---|---|---|---|---|---|---|---|---|---|---|---|---|
| Current age | ||||||||||||||||||||||||||||||||||||||||||||||||||||||||||||||||||||||||||||||||||||||||||||||||||||
| 18-29 | 63 | |||||||||||||||||||||||||||||||||||||||||||||||||||||||||||||||||||||||||||||||||||||||||||||||||||
| 30-49 | 65 | |||||||||||||||||||||||||||||||||||||||||||||||||||||||||||||||||||||||||||||||||||||||||||||||||||
| 50-64 | 67 | |||||||||||||||||||||||||||||||||||||||||||||||||||||||||||||||||||||||||||||||||||||||||||||||||||
| GALLUP, April 2-11, 2018 | ||||||||||||||||||||||||||||||||||||||||||||||||||||||||||||||||||||||||||||||||||||||||||||||||||||
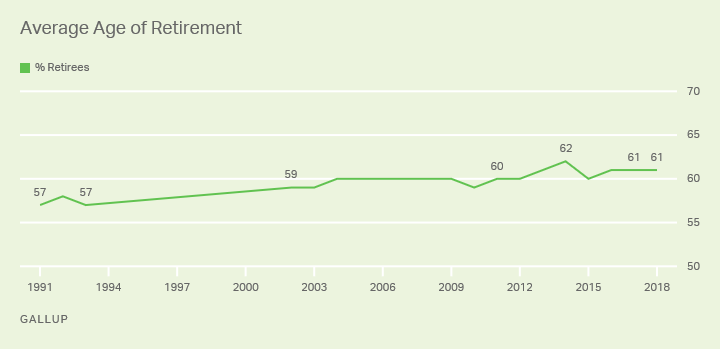
The average reported retirement age for Americans who are currently retired is 61, considerably lower than the age at which current nonretirees say they will retire.
The age of retirement has risen slightly since Gallup began measuring it 27 years ago. In the five Gallup surveys conducted between 1991 and 2003, the average age of retirees was 58. From 2004 to 2010, the average retirement age among retirees rose to 60, and it has averaged 61 since 2011.
The gap between the higher projected and lower actual age of retirement has been evident for decades in Gallup's surveys. Still, the average retirement age of those in the retired pool today is not necessarily a strong predictor of when current workers will end up retiring in the future. For some nonretirees, retirement is 30 or more years away, and circumstances, including the economy, Social Security laws, healthcare and longevity, may be very different at that point in time. Some in the retired group actually retired 30 years ago, when the circumstances were also very different. Overall, however, the persistence of this gap suggests that at least some Americans may end up leaving the workforce earlier than they anticipated.
Survey Methods
Results for this Gallup poll are based on telephone interviews conducted April 2-11, 2018, with a random sample of 1,015 adults, aged 18 and older, living in all 50 U.S. states and the District of Columbia. For results based on the total sample of national adults, the margin of sampling error is ±4 percentage points at the 95% confidence level. For results based on the sample of -- 320 -- retirees, the margin of sampling error is ±7 percentage points. For results based on the sample of -- 695 -- non-retirees, the margin of sampling error is ±5 percentage points.
All reported margins of sampling error include computed design effects for weighting.
Each sample of national adults includes a minimum quota of 70% cellphone respondents and 30% landline respondents, with additional minimum quotas by time zone within region. Landline and cellular telephone numbers are selected using random-digit-dial methods.
View survey methodology, complete question responses and trends.
Learn more about how the Gallup Poll Social Series works.