Story Highlights
- Satisfaction rate of 38% is highest since September 2005
- Second month in a row above 35%, also for the first time since 2005
- Satisfaction rises among Republicans and independents, not among Democrats
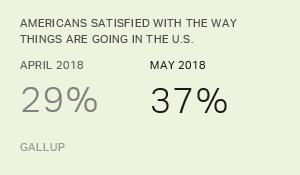
WASHINGTON, D.C. -- Thirty-eight percent of Americans are satisfied with the way things are going in the United States today, similar to last month's 37% satisfaction rate but marking the numerical high since a 39% reading in September 2005.
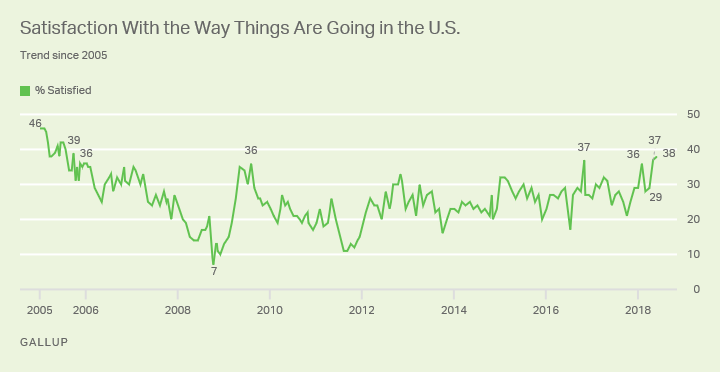
The satisfaction rate, which Gallup has measured at least monthly since 2001, has now topped 35% three times this year -- a level reached only three times in the previous 12 years (once each in 2006, 2009 and 2016).
Satisfaction with the nation is now back to the historical average of 37% for this trend, which was first measured in 1979, but is far below the majority levels reached in the economic boom times of the mid-1980s and late 1990s.
In its first four years (1979 and 1981-1983), satisfaction failed to reach 37% in any poll, but then routinely reached or exceeded that level in 1984 through 2005 polling, with the exception of 1992-1995 (excluding one 36% reading in 1994). After a January 2006 reading of 36%, satisfaction failed to surpass 35% the rest of that year, and with the economic calamities that followed over the next few years, it descended into single digits in two 2008 polls and has subsequently stayed mostly below 30%.
The rise in satisfaction over the past two months comes amid a spate of positive economic news -- including the shrinking of the unemployment rate to levels last seen in 2000 and the continuation of an economic expansion that is now the second longest on record. Other prominent national news stories have included independent counsel Robert Mueller's investigation into Russian collusion; President Donald Trump's decision to withdraw the United States from the Iran nuclear deal; and Trump's negotiations with North Korea that culminated in his meeting Tuesday with North Korean leader Kim Jong Un.
Rise in Republican, Independent Satisfaction Pushes Rate Up Over Past Two Months
U.S. satisfaction has averaged 38% in May and June after averaging 29% in March and April. The nine-percentage-point bump between the two periods is entirely owing to increased satisfaction among Republicans and independents, pushing Republicans' satisfaction to 68% and independents' to 36%. Meanwhile, Democrats' satisfaction is unchanged at 13%.
| March-April | May-June | Increase | ||||||||||||||||||||||||||||||||||||||||||||||||||||||||||||||||||||||||||||||||||||||||||||||||||
|---|---|---|---|---|---|---|---|---|---|---|---|---|---|---|---|---|---|---|---|---|---|---|---|---|---|---|---|---|---|---|---|---|---|---|---|---|---|---|---|---|---|---|---|---|---|---|---|---|---|---|---|---|---|---|---|---|---|---|---|---|---|---|---|---|---|---|---|---|---|---|---|---|---|---|---|---|---|---|---|---|---|---|---|---|---|---|---|---|---|---|---|---|---|---|---|---|---|---|---|---|
| % | % | pct. pts. | ||||||||||||||||||||||||||||||||||||||||||||||||||||||||||||||||||||||||||||||||||||||||||||||||||
| All adults | 29 | 38 | 9 | |||||||||||||||||||||||||||||||||||||||||||||||||||||||||||||||||||||||||||||||||||||||||||||||||
| Party ID | ||||||||||||||||||||||||||||||||||||||||||||||||||||||||||||||||||||||||||||||||||||||||||||||||||||
| Republicans | 54 | 68 | 14 | |||||||||||||||||||||||||||||||||||||||||||||||||||||||||||||||||||||||||||||||||||||||||||||||||
| Independents | 25 | 36 | 11 | |||||||||||||||||||||||||||||||||||||||||||||||||||||||||||||||||||||||||||||||||||||||||||||||||
| Democrats | 13 | 13 | 0 | |||||||||||||||||||||||||||||||||||||||||||||||||||||||||||||||||||||||||||||||||||||||||||||||||
| Place of residence | ||||||||||||||||||||||||||||||||||||||||||||||||||||||||||||||||||||||||||||||||||||||||||||||||||||
| Small/Large city | 25 | 33 | 8 | |||||||||||||||||||||||||||||||||||||||||||||||||||||||||||||||||||||||||||||||||||||||||||||||||
| Suburb | 32 | 38 | 6 | |||||||||||||||||||||||||||||||||||||||||||||||||||||||||||||||||||||||||||||||||||||||||||||||||
| Town/Rural area | 30 | 44 | 14 | |||||||||||||||||||||||||||||||||||||||||||||||||||||||||||||||||||||||||||||||||||||||||||||||||
| Age | ||||||||||||||||||||||||||||||||||||||||||||||||||||||||||||||||||||||||||||||||||||||||||||||||||||
| 18-34 | 26 | 33 | 7 | |||||||||||||||||||||||||||||||||||||||||||||||||||||||||||||||||||||||||||||||||||||||||||||||||
| 35-54 | 30 | 37 | 7 | |||||||||||||||||||||||||||||||||||||||||||||||||||||||||||||||||||||||||||||||||||||||||||||||||
| 55+ | 29 | 41 | 12 | |||||||||||||||||||||||||||||||||||||||||||||||||||||||||||||||||||||||||||||||||||||||||||||||||
| Gender | ||||||||||||||||||||||||||||||||||||||||||||||||||||||||||||||||||||||||||||||||||||||||||||||||||||
| Men | 37 | 45 | 8 | |||||||||||||||||||||||||||||||||||||||||||||||||||||||||||||||||||||||||||||||||||||||||||||||||
| Women | 21 | 31 | 10 | |||||||||||||||||||||||||||||||||||||||||||||||||||||||||||||||||||||||||||||||||||||||||||||||||
| Education | ||||||||||||||||||||||||||||||||||||||||||||||||||||||||||||||||||||||||||||||||||||||||||||||||||||
| No college | 31 | 40 | 9 | |||||||||||||||||||||||||||||||||||||||||||||||||||||||||||||||||||||||||||||||||||||||||||||||||
| Some college | 29 | 39 | 10 | |||||||||||||||||||||||||||||||||||||||||||||||||||||||||||||||||||||||||||||||||||||||||||||||||
| College grad | 27 | 37 | 10 | |||||||||||||||||||||||||||||||||||||||||||||||||||||||||||||||||||||||||||||||||||||||||||||||||
| Postgrad | 23 | 30 | 7 | |||||||||||||||||||||||||||||||||||||||||||||||||||||||||||||||||||||||||||||||||||||||||||||||||
| Columns reflect combined Gallup polls of March 1-8 and April 2-11; and May 1-10 and June 1-13 | ||||||||||||||||||||||||||||||||||||||||||||||||||||||||||||||||||||||||||||||||||||||||||||||||||||
| GALLUP | ||||||||||||||||||||||||||||||||||||||||||||||||||||||||||||||||||||||||||||||||||||||||||||||||||||
Differences by place of residence, age, gender and education are mostly not as large as by party identification, and the amount of change from March-April to May-June was fairly uniform within the former groups. Democrats were the only major demographic group to show no increase in satisfaction. Those in groups that tend to have more Democrats than Republicans -- those younger than 35, city dwellers, women and those with postgraduate work -- are least likely to be satisfied, but satisfaction levels rose for all of these groups in the May-June aggregate.
Bottom Line
Though the vast majority of Americans have expressed pride in their country in polls stretching back more than 30 years, their pride has not meant they were satisfied with the way things were going. This has been especially true during times of economic duress -- though measuring the public's satisfaction with the nation encompasses far more than economics.
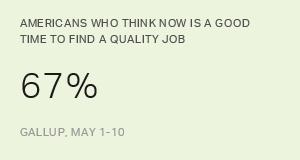
Now, at the midpoint of 2018, as the United States continues to enjoy a nine-year-long economic expansion, the number of Americans finding satisfaction in the country's direction is on the rise. This reflects more than a growing comfort with Donald Trump as president; growth in satisfaction has outstripped growth in Trump's approval rating. And it is more than economic good news -- the percentage satisfied has risen more over the past two months than the percentage who think the economy is in good shape or the percentage who think it's a good time to find a quality job.
As the nation moves toward November's midterm elections, as the Mueller investigation continues to unfold, as Trump continues to surprise both friends and foes with his actions, there are a multitude of possibilities for news that could affect satisfaction significantly in either direction.
Survey Methods
Results for this Gallup poll are based on telephone interviews conducted June 1-13, 2018, with a random sample of 1,520 adults, aged 18 and older, living in all 50 U.S. states and the District of Columbia. For results based on the total sample of national adults, the margin of sampling error is ±3 percentage points at the 95% confidence level.
Each sample of national adults includes a minimum quota of 70% cellphone respondents and 30% landline respondents, with additional minimum quotas by time zone within region. Landline and cellular telephone numbers are selected using random-digit-dial methods.
View survey methodology, complete question responses and trends.
Learn more about how the Gallup Poll Social Series works.