Story Highlights
- 56% are "absolutely certain" to vote, similar to 2014 but a bit low historically
- Republicans, Democrats equally likely to say they're certain to vote this fall
- Roughly equal percentages intend their vote to be for Trump as against him
WASHINGTON, D.C. -- Fifty-six percent of U.S. adults are currently "absolutely certain" they will vote in the November elections for Congress. That's on the low side in Gallup's trend of final pre-election midterm polls since 1954 and is similar to the 58% recorded just before the 2014 midterms, which had the lowest turnout rate since 1942.
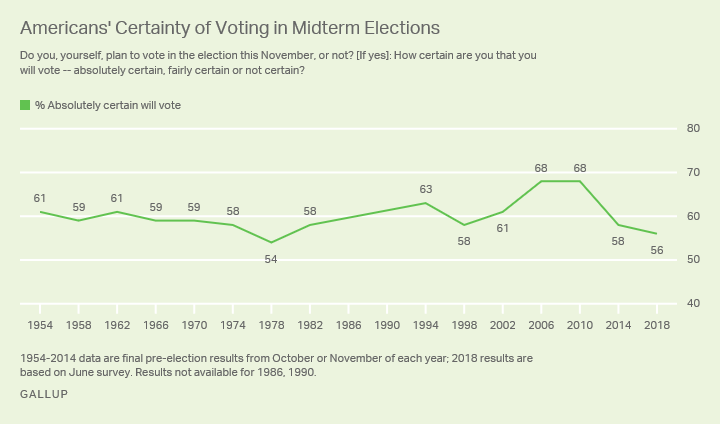
The overall percentage of U.S. adults describing themselves as absolutely certain to vote in a midterm election has ranged from as low as 54% right before the 1978 midterms to a high of 68% in both 2006 and 2010. Gallup has not routinely asked the question this soon in a midterm year, but in years for which early measures are available (1982, 1998, 2002 and 2010), adults' intention to vote changed little over the course of the campaign.
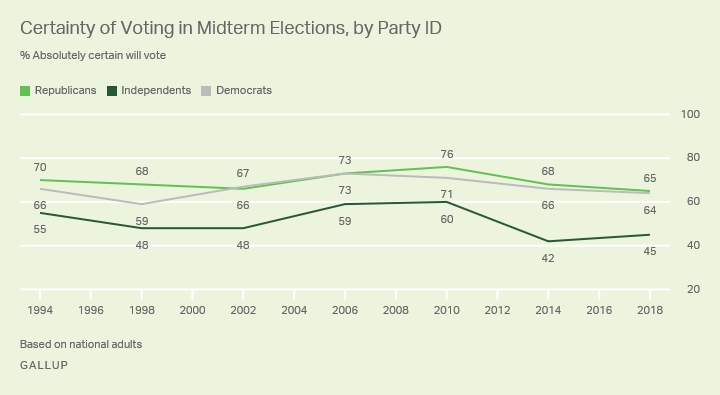
There is currently no difference in turnout intention by party: 65% of Republicans and 64% of Democrats say they are absolutely certain to vote. As is normal, independents are less certain of voting, at 45%.
Gallup also found parity between Republicans' and Democrats' certainty of voting in 2002, 2006 and 2014. In two of those years, 2002 and 2014, Republicans picked up seats in the U.S. House of Representatives, but 2006 was a year of big Democratic gains. Of the three midterm election years when Republicans had a slight edge on certainty to vote, the party performed very well in two (1994 and 2010) but not in the third (1998).
Little Presidential Backlash Evident in Vote for Congress
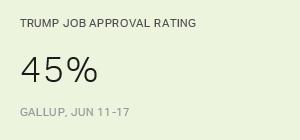
Other data from Gallup's June 11-17 survey suggest that the 2018 midterm elections may not produce the blue wave that was suggested by earlier polling. In particular, President Donald Trump's job approval rating averaged 45% over the week of interviewing that mostly followed his June 12 summit with North Korean leader Kim Jong Un -- matching his post-inaugural high.
Also, when asked whether their vote for a congressional candidate will be made to send a positive or a negative message about Trump, about as many registered voters who plan to vote say they will be sending a message to support Trump (20%) as to oppose him (23%). The slight majority (53%) say they will not be sending a message with their vote.
| Message to support | Message to oppose | Not sending a message | ||||||||||||||||||||||||||||||||||||||||||||||||||||||||||||||||||||||||||||||||||||||||||||||||||
|---|---|---|---|---|---|---|---|---|---|---|---|---|---|---|---|---|---|---|---|---|---|---|---|---|---|---|---|---|---|---|---|---|---|---|---|---|---|---|---|---|---|---|---|---|---|---|---|---|---|---|---|---|---|---|---|---|---|---|---|---|---|---|---|---|---|---|---|---|---|---|---|---|---|---|---|---|---|---|---|---|---|---|---|---|---|---|---|---|---|---|---|---|---|---|---|---|---|---|---|---|
| % | % | % | ||||||||||||||||||||||||||||||||||||||||||||||||||||||||||||||||||||||||||||||||||||||||||||||||||
| Donald Trump | ||||||||||||||||||||||||||||||||||||||||||||||||||||||||||||||||||||||||||||||||||||||||||||||||||||
| 2018 Jun 11-17 | 20 | 23 | 53 | |||||||||||||||||||||||||||||||||||||||||||||||||||||||||||||||||||||||||||||||||||||||||||||||||
| Barack Obama | ||||||||||||||||||||||||||||||||||||||||||||||||||||||||||||||||||||||||||||||||||||||||||||||||||||
| 2014 Oct 29-Nov 2 | 17 | 30 | 51 | |||||||||||||||||||||||||||||||||||||||||||||||||||||||||||||||||||||||||||||||||||||||||||||||||
| 2014 Sep 25-30 | 20 | 32 | 46 | |||||||||||||||||||||||||||||||||||||||||||||||||||||||||||||||||||||||||||||||||||||||||||||||||
| 2014 Apr 24-30 | 24 | 30 | 43 | |||||||||||||||||||||||||||||||||||||||||||||||||||||||||||||||||||||||||||||||||||||||||||||||||
| 2010 Oct 28-31 | 22 | 30 | 44 | |||||||||||||||||||||||||||||||||||||||||||||||||||||||||||||||||||||||||||||||||||||||||||||||||
| George W. Bush | ||||||||||||||||||||||||||||||||||||||||||||||||||||||||||||||||||||||||||||||||||||||||||||||||||||
| 2006 Nov 2-5 | 18 | 31 | 46 | |||||||||||||||||||||||||||||||||||||||||||||||||||||||||||||||||||||||||||||||||||||||||||||||||
| 2002 Oct 31-Nov 3 | 28 | 15 | 53 | |||||||||||||||||||||||||||||||||||||||||||||||||||||||||||||||||||||||||||||||||||||||||||||||||
| Based on registered voters | ||||||||||||||||||||||||||||||||||||||||||||||||||||||||||||||||||||||||||||||||||||||||||||||||||||
| Gallup | ||||||||||||||||||||||||||||||||||||||||||||||||||||||||||||||||||||||||||||||||||||||||||||||||||||
By contrast, in both midterms held during Barack Obama's presidency, as well as in 2006 under George W. Bush -- all years in which the president's party lost House seats -- more voters said they would be sending a message against the president than for him. The 2002 elections were an exception when, with Bush's job approval rating exceeding 60% a year after 9/11, nearly twice as many voters planned to send a message to support rather than protest Bush. That year, Bush's Republican Party increased its share of congressional seats, a rare occurrence for the president's party in midterms.
The 48% of Republican registered voters currently saying they are sending a message in support of Trump with their vote is slightly less than the 52% of Democratic voters saying this about Obama in his first midterm year, in 2010. At the same time, fewer Democrats today (50%) than Republicans in 2010 (60%) plan to use their vote as a message against the sitting president from the opposing party. The pattern with Obama was similar in 2014, only with Democrats slightly less likely to be sending a message of support with their vote than they were in 2010.
More generally, Trump receives a level of support in Republicans' "message" in their vote for Congress that is similar to what Obama and Bush received from their party members, while Trump generates fewer protest votes from the opposition. Again, 2002 was an exception as Bush received more support that year from his own party members (55%) and fewer protest votes from the opposing party (30%) than was seen for him or Obama in subsequent midterm years.
| To support president (own party) | To oppose president (other party) | ||||||||||||||||||||||||||||||||||||||||||||||||||||||||||||||||||||||||||||||||||||||||||||||||||
|---|---|---|---|---|---|---|---|---|---|---|---|---|---|---|---|---|---|---|---|---|---|---|---|---|---|---|---|---|---|---|---|---|---|---|---|---|---|---|---|---|---|---|---|---|---|---|---|---|---|---|---|---|---|---|---|---|---|---|---|---|---|---|---|---|---|---|---|---|---|---|---|---|---|---|---|---|---|---|---|---|---|---|---|---|---|---|---|---|---|---|---|---|---|---|---|---|---|---|---|
| % | % | ||||||||||||||||||||||||||||||||||||||||||||||||||||||||||||||||||||||||||||||||||||||||||||||||||
| 2018 June 11-17 (Trump) | 48 | 50 | |||||||||||||||||||||||||||||||||||||||||||||||||||||||||||||||||||||||||||||||||||||||||||||||||
| 2014 Oct 29-Nov 2 (Obama) | 41 | 62 | |||||||||||||||||||||||||||||||||||||||||||||||||||||||||||||||||||||||||||||||||||||||||||||||||
| 2010 Oct 28-31 (Obama) | 52 | 60 | |||||||||||||||||||||||||||||||||||||||||||||||||||||||||||||||||||||||||||||||||||||||||||||||||
| 2006 Nov 2-5 (Bush) | 42 | 56 | |||||||||||||||||||||||||||||||||||||||||||||||||||||||||||||||||||||||||||||||||||||||||||||||||
| 2002 Oct 31-Nov 3 (Bush) | 55 | 30 | |||||||||||||||||||||||||||||||||||||||||||||||||||||||||||||||||||||||||||||||||||||||||||||||||
| Based on registered voters (2010, 2014, 2018); based on national adults (2002, 2006) | |||||||||||||||||||||||||||||||||||||||||||||||||||||||||||||||||||||||||||||||||||||||||||||||||||
| Gallup | |||||||||||||||||||||||||||||||||||||||||||||||||||||||||||||||||||||||||||||||||||||||||||||||||||
Democrats Hold Slight Edge on Generic Ballot
An additional indication that the 2018 midterms will be more of a conventional than a wave election comes from the generic ballot. When Gallup asked registered voters which party's candidate they plan to vote for in November, 48% said they will support the Democrat and 43% the Republican.
This slight Democratic edge among registered voters suggests that the party could gain House seats in November, but not necessarily enough to regain majority control. Because Democrats' turnout is usually lower than Republicans' in midterm years, voting intentions among registered voters can overstate the former party's eventual performance at the polls. For instance, Democrats enjoyed an 11-point lead in the generic ballot among registered voters in the 2006 Democratic wave election but had an eight-point advantage in the U.S. two-party vote nationally.
Importantly, all three indicators -- certainty to vote, sending a message and party preferences on the generic ballot -- are preliminary, as voter attitudes on each could change between now and November.
Bottom Line
Seat losses in Congress are the norm for the president's party in midterm elections, especially in a first term and particularly when the president's job approval rating is below 50%. While improved at 45%, Trump's job rating remains in this danger zone and could already be worse, given the shift in news focus from North Korea to the controversy over his administration's handling of children entering the country illegally with their parents at the Southern border.
Still, for a wave election to occur, Democrats would need to turn out to vote in greater numbers than usual relative to Republicans and/or would need to be leading in the generic ballot among registered voters by close to double digits. Democrats may also need to feel energized to use their congressional vote to send a message against the president, something they are less inclined to do right now than Republicans were when Obama was in office.
All of these indicators are preliminary and subject to change, but they provide a good baseline from which to watch the elections unfold in the coming months.
Survey Methods
Results for this Gallup poll are based on telephone interviews conducted June 11-17, 2018, on the Gallup U.S. Poll, with a random sample of 1,511 adults, aged 18 and older, living in all 50 U.S. states and the District of Columbia. For results based on the total sample of national adults, the margin of sampling error is ±3 percentage points at the 95% confidence level. For results based on the sample of 1,346 registered voters, the margin of error is ±3 percentage points at the 95% confidence level.
All reported margins of sampling error include computed design effects for weighting.
Each sample of national adults includes a minimum quota of 70% cellphone respondents and 30% landline respondents, with additional minimum quotas by time zone within region. Landline and cellular telephone numbers are selected using random-digit-dial methods.
View survey methodology, complete question responses and trends.
Learn more about how the Gallup U.S. Poll works.