GALLUP NEWS SERVICE
PRINCETON, NJ -- Gallup's annual Work and Education survey, conducted Aug. 7-10, finds that Americans are nearly twice as likely to say they would prefer to have a man rather than a woman as a boss if they were accepting a new job. But an even higher percentage volunteers that the gender of their new boss would make no difference. While most men say it would not matter whether their boss is male or female, women are more likely to prefer a male boss. Younger Americans are equally likely to say they prefer a male or female boss, but older Americans are much more inclined to prefer a male boss.
Overall Results
By a 37% to 19% margin, Americans say that, if they were taking a new job, they would prefer their boss to be a man rather than a woman. Forty-three percent of Americans volunteer that it would not make a difference to them. The results on this question have fluctuated substantially over the years, but relatively few Americans -- no more than 22% -- have said they would prefer a female boss.
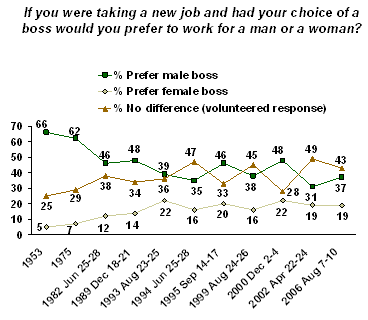
Gallup first asked this question in 1953, and at that time, two in three Americans said they would prefer a male boss, while just 5% said they would prefer a female boss, with 25% volunteering it would make no difference. Beginning in 1982, sentiments shifted and greater numbers of Americans said they would prefer a female boss or said their boss's gender didn't matter to them. In more recent years, a plurality of Americans have volunteered that gender makes no difference to them, but the preference for a male boss among those who have a preference has been observed in every poll in which this question has been asked over the years.
Men vs. Women
Men and women differ significantly in their preferences for a boss, but the preference for a male boss among those who have a preference is observed among both genders. Women are more likely than men to state a specific preference for the gender of their boss, while men are more likely to say the gender of their boss does not matter to them.
A majority of men, 56%, say it makes no difference whether their boss is a man or a woman, while those who have a preference favor a man (34%) rather than a woman (10%). Among women, 40% say they would prefer a new boss to be a man, while 26% would prefer a woman. Thirty-two percent of women say it makes no difference.
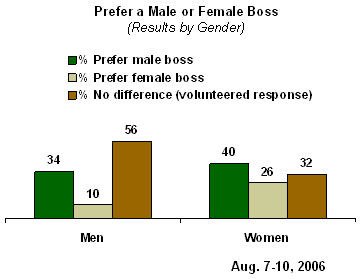
Historically, when both men and women give a preference for their new boss, both groups would choose a male boss rather than a female boss.
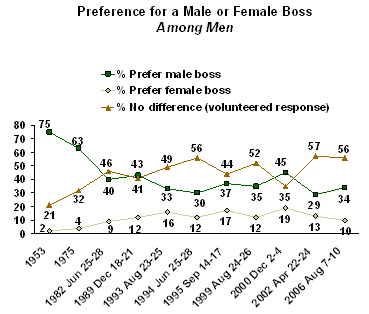
Since 1982, men have become more likely to tell Gallup that the gender of their boss does not matter to them. Still, no more than 19% of men have ever said they would prefer a female boss.
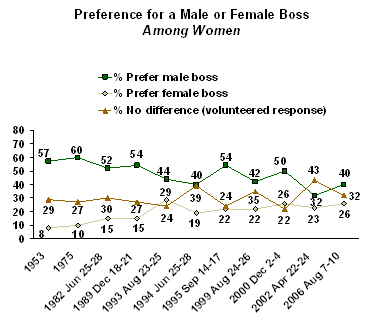
In most of the surveys -- from 1953 through 1993, then from 1995 through 2000, and now in the current poll again -- women have been most likely to say they would prefer a male boss. Women are somewhat more likely than men to say they would prefer a female boss, but only about one in four women typically do.
Younger vs. Older Americans
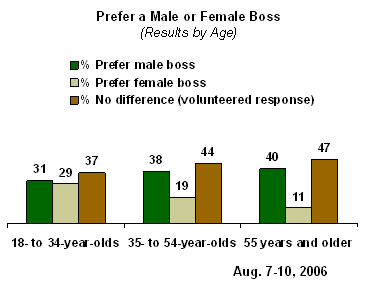
The current poll also finds significant differences between younger and older Americans. Younger adults between the ages of 18 and 34 are equally likely to say they prefer a male (31%) or female (29%) boss if they were taking a new job. Americans aged 35 and older are at least twice as likely to say their preference for a new boss would be a man rather than a woman. Across all three age groups, respondents most frequently say their boss's gender does not matter to them.
Survey Methods
The latest results are based on telephone interviews with a randomly selected national sample of 1,007 adults, aged 18 and older, conducted Aug. 7-10, 2006. For results based on this sample, one can say with 95% confidence that the maximum error attributable to sampling and other random effects is ±3 percentage points. In addition to sampling error, question wording and practical difficulties in conducting surveys can introduce error or bias into the findings of public opinion polls.
28. If you were taking a new job and had your choice of a boss would you prefer to work for a man or a woman?
|
|
|
NO |
|
|
|
|
% |
% |
% |
% |
|
National Adults |
|
|
|
|
|
2006 Aug 7-10 |
37 |
19 |
43 |
1 |
|
2002 Apr 22-24 |
31 |
19 |
49 |
1 |
|
2000 Dec 2-4 |
48 |
22 |
28 |
2 |
|
1999 Aug 24-26 |
38 |
16 |
45 |
1 |
|
1995 Sep 14-17 |
46 |
20 |
33 |
1 |
|
1994 Jun 25-28 |
35 |
16 |
47 |
2 |
|
1993 Aug 23-25 |
39 |
22 |
36 |
3 |
|
1989 Dec 18-21 |
48 |
14 |
34 |
4 |
|
1982 Jun 25-28 |
46 |
12 |
38 |
4 |
|
1975 |
62 |
7 |
29 |
2 |
|
1953 |
66 |
5 |
25 |
4 |
|
|
|
|
|
|
|
Men |
|
|
|
|
|
2006 Aug 7-10 |
34 |
10 |
56 |
* |
|
2002 Apr 22-24 |
29 |
13 |
57 |
1 |
|
2000 Dec 2-4 |
45 |
19 |
35 |
1 |
|
1999 Aug 24-26 |
35 |
12 |
52 |
1 |
|
1995 Sep 14-17 |
37 |
17 |
44 |
2 |
|
1994 Jun 25-28 |
30 |
12 |
56 |
3 |
|
1993 Aug 23-25 |
33 |
16 |
49 |
2 |
|
1989 Dec 18-21 |
43 |
12 |
41 |
4 |
|
1982 Jun 25-28 |
40 |
9 |
46 |
5 |
|
1975 |
63 |
4 |
32 |
1 |
|
1953 |
75 |
2 |
21 |
2 |
|
|
|
|
|
|
|
Women |
|
|
|
|
|
2006 Aug 7-10 |
40 |
26 |
32 |
2 |
|
2002 Apr 22-24 |
32 |
23 |
43 |
2 |
|
2000 Dec 2-4 |
50 |
26 |
22 |
2 |
|
1999 Aug 24-26 |
42 |
22 |
35 |
1 |
|
1995 Sep 14-17 |
54 |
22 |
24 |
* |
|
1994 Jun 25-28 |
40 |
19 |
39 |
2 |
|
1993 Aug 23-25 |
44 |
29 |
24 |
3 |
|
1989 Dec 18-21 |
54 |
15 |
27 |
4 |
|
1982 Jun 25-28 |
52 |
15 |
30 |
3 |
|
1975 |
60 |
10 |
27 |
3 |
|
1953 |
57 |
8 |
29 |
6 |
|
(vol.) = Volunteered response |
||||
