Story Highlights
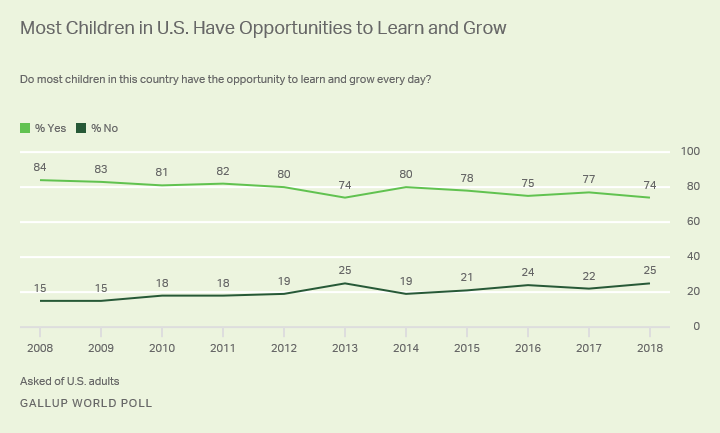
- Majority in U.S. (74%) say most children have opportunities to learn and grow
- U.S. has dropped from 31st in the world to 69th
Aug. 12 marks International Youth Day, which this year focuses on efforts to make education more relevant, equitable and inclusive for all the world's youth. This analysis is one of two that looks at how people around the world view opportunities for children in their countries to learn and grow.
WASHINGTON, D.C. -- As children across the U.S. begin a new school year, a majority of Americans (74%) continue to believe most children in their country have the opportunity to learn and grow every day, but they are solidly less likely to think so today than they were a decade ago.
As a result of this downturn, the U.S. has dropped from 31st to 69th in the world on this measure since 2008, putting its current ranking well behind those of many wealthy economies and global competitors, including China.

No single U.S. demographic group is chiefly responsible for the decline. Americans from almost every walk of life are less likely to see opportunities for most children in the U.S. to learn and grow than they were 10 years ago.
However, attitudes among U.S. women, Americans with college degrees, rural residents and the wealthiest 20% of Americans have worsened the most, all dropping by more than 10 percentage points within that 10-year time frame.
| 2008 | 2018 | Difference | |||||||||||||||||||||||||||||||||||||||||||||||||||||||||||||||||||||||||||||||||||||||||||||||||
|---|---|---|---|---|---|---|---|---|---|---|---|---|---|---|---|---|---|---|---|---|---|---|---|---|---|---|---|---|---|---|---|---|---|---|---|---|---|---|---|---|---|---|---|---|---|---|---|---|---|---|---|---|---|---|---|---|---|---|---|---|---|---|---|---|---|---|---|---|---|---|---|---|---|---|---|---|---|---|---|---|---|---|---|---|---|---|---|---|---|---|---|---|---|---|---|---|---|---|---|
| % Yes | % Yes | (pct. pts.) | |||||||||||||||||||||||||||||||||||||||||||||||||||||||||||||||||||||||||||||||||||||||||||||||||
| Men | 85 | 81 | -4 | ||||||||||||||||||||||||||||||||||||||||||||||||||||||||||||||||||||||||||||||||||||||||||||||||
| Women | 82 | 66 | -16 | ||||||||||||||||||||||||||||||||||||||||||||||||||||||||||||||||||||||||||||||||||||||||||||||||
| Less than tertiary | 85 | 77 | -8 | ||||||||||||||||||||||||||||||||||||||||||||||||||||||||||||||||||||||||||||||||||||||||||||||||
| Tertiary complete | 81 | 67 | -14 | ||||||||||||||||||||||||||||||||||||||||||||||||||||||||||||||||||||||||||||||||||||||||||||||||
| Urban | 81 | 74 | -7 | ||||||||||||||||||||||||||||||||||||||||||||||||||||||||||||||||||||||||||||||||||||||||||||||||
| Rural | 86 | 74 | -12 | ||||||||||||||||||||||||||||||||||||||||||||||||||||||||||||||||||||||||||||||||||||||||||||||||
| Poorest 20% | 80* | 72 | -8 | ||||||||||||||||||||||||||||||||||||||||||||||||||||||||||||||||||||||||||||||||||||||||||||||||
| Richest 20% | 87* | 71 | -16 | ||||||||||||||||||||||||||||||||||||||||||||||||||||||||||||||||||||||||||||||||||||||||||||||||
| *Gallup started collecting income data in the U.S. in 2009. | |||||||||||||||||||||||||||||||||||||||||||||||||||||||||||||||||||||||||||||||||||||||||||||||||||
| Gallup World Poll | |||||||||||||||||||||||||||||||||||||||||||||||||||||||||||||||||||||||||||||||||||||||||||||||||||
Interestingly, the demographic groups with the biggest declines over the past decade are not necessarily the areas where the biggest divides exist within the U.S. population. For example, little currently separates the attitudes of the wealthiest 20% and the poorest 20% of Americans and, likewise, urban and rural Americans are in perfect alignment.
| Yes | No | ||||||||||||||||||||||||||||||||||||||||||||||||||||||||||||||||||||||||||||||||||||||||||||||||||
|---|---|---|---|---|---|---|---|---|---|---|---|---|---|---|---|---|---|---|---|---|---|---|---|---|---|---|---|---|---|---|---|---|---|---|---|---|---|---|---|---|---|---|---|---|---|---|---|---|---|---|---|---|---|---|---|---|---|---|---|---|---|---|---|---|---|---|---|---|---|---|---|---|---|---|---|---|---|---|---|---|---|---|---|---|---|---|---|---|---|---|---|---|---|---|---|---|---|---|---|
| % | % | ||||||||||||||||||||||||||||||||||||||||||||||||||||||||||||||||||||||||||||||||||||||||||||||||||
| Men | 81 | 18 | |||||||||||||||||||||||||||||||||||||||||||||||||||||||||||||||||||||||||||||||||||||||||||||||||
| Women | 66 | 33 | |||||||||||||||||||||||||||||||||||||||||||||||||||||||||||||||||||||||||||||||||||||||||||||||||
| Less than tertiary | 77 | 22 | |||||||||||||||||||||||||||||||||||||||||||||||||||||||||||||||||||||||||||||||||||||||||||||||||
| Tertiary complete | 67 | 32 | |||||||||||||||||||||||||||||||||||||||||||||||||||||||||||||||||||||||||||||||||||||||||||||||||
| Urban | 74 | 25 | |||||||||||||||||||||||||||||||||||||||||||||||||||||||||||||||||||||||||||||||||||||||||||||||||
| Rural | 74 | 25 | |||||||||||||||||||||||||||||||||||||||||||||||||||||||||||||||||||||||||||||||||||||||||||||||||
| Poorest 20% | 72 | 28 | |||||||||||||||||||||||||||||||||||||||||||||||||||||||||||||||||||||||||||||||||||||||||||||||||
| Richest 20% | 71 | 27 | |||||||||||||||||||||||||||||||||||||||||||||||||||||||||||||||||||||||||||||||||||||||||||||||||
| Gallup World Poll, 2018 | |||||||||||||||||||||||||||||||||||||||||||||||||||||||||||||||||||||||||||||||||||||||||||||||||||
Women and men, on the other hand, have never been further apart. For the past decade, U.S. women have typically been less likely than U.S. men to say that children in the country have opportunities to learn and grow every day, and in 2018 that gulf widened to 15 percentage points. This gender gap persists regardless of whether men and women say they have children living in their households.
Implications
As much of the world works toward the Sustainable Development Goal (SDG) to "ensure inclusive and equitable quality education and promote lifelong learning opportunities for all," the trajectory in the U.S. appears to be pointed in the wrong direction -- based on the diminishing numbers of Americans who see opportunities for most children in their country to learn and grow.
These data, along with findings from a recent UNICEF report that found the U.S. losing ground on six out of nine child-relevant SDG indicators -- including inclusive quality education -- reinforce that a roaring economy alone doesn't always guarantee a good record on sustaining children's wellbeing.
For complete methodology and specific survey dates, please review Gallup's Country Data Set details.
Learn more about how the Gallup World Poll works.


