Story Highlights
- Averages 40.7%, down from 42.7%
- Has had lower averages in five of 10 previous quarters
- Obama had similar 11th-quarter average; only Carter's was worse
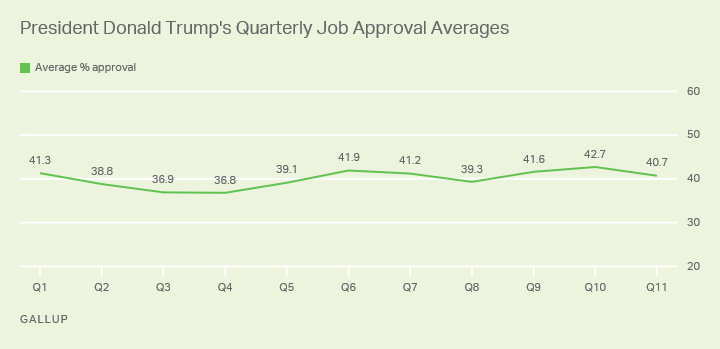
WASHINGTON, D.C. -- President Donald Trump's approval ratings averaged 40.7% during his 11th quarter in office, which began on July 20 and ends Oct. 19. His average is down two percentage points from his prior quarter; however, he has had lower averages in five other quarters.

Perhaps the most notable aspect of Trump's quarterly average approval ratings is their stability. Less than six points separate his highest (42.7%) and lowest (36.8%) quarterly averages. By comparison, for the nine other post-World War II presidents who were elected to their first term, the average difference between the high and low quarterly averages over their first 11 quarters in office is 21 percentage points.
The stability in Trump's job approval ratings is likely a result of the marked polarization in his approval ratings, with very low approval among Democrats and very high approval among Republicans. The extreme polarization also explains why Trump did not have a "honeymoon" period of higher ratings early in his term and has not enjoyed a "rally" in approval tied to some significant event.
Although Trump's job approval did not change much in his 11th quarter, the period was an eventful one for him. Calls for his impeachment intensified after a whistleblower alleged that the president pressured the Ukrainian government to conduct an investigation into potential 2020 election opponent Joe Biden and his son. A slim majority of Americans now favor Trump being impeached and removed from office.
Other key events during the 11th quarter were Trump's firing of national security adviser John Bolton after negotiations to end U.S. involvement in the Afghanistan War broke down, and mass shootings in Texas and Ohio.
Trump's 11th Quarter Similar to Obama's 11th Quarter
Trump's 40.7% 11th-quarter average is most similar to that of his immediate predecessor, Barack Obama, among post-World War II elected presidents. Only Jimmy Carter had worse numbers, with an average 31% job approval rating in his 11th quarter, in 1979, as the nation dealt with a struggling economy and energy crisis. Ronald Reagan (in 1983) and Bill Clinton (1995) join Carter, Obama and Trump with sub-50% 11th-quarter approval ratings.
Dwight Eisenhower (in 1955) had the highest job approval rating in an 11th quarter, with George H.W. Bush (in 1991) second.
| Dates | Average % approval | Number of polls | |||||||||||||||||||||||||||||||||||||||||||||||||||||||||||||||||||||||||||||||||||||||||||||||||
|---|---|---|---|---|---|---|---|---|---|---|---|---|---|---|---|---|---|---|---|---|---|---|---|---|---|---|---|---|---|---|---|---|---|---|---|---|---|---|---|---|---|---|---|---|---|---|---|---|---|---|---|---|---|---|---|---|---|---|---|---|---|---|---|---|---|---|---|---|---|---|---|---|---|---|---|---|---|---|---|---|---|---|---|---|---|---|---|---|---|---|---|---|---|---|---|---|---|---|---|
| Eisenhower | Jul 20-Oct 19, 1955 | 72.7 | 3 | ||||||||||||||||||||||||||||||||||||||||||||||||||||||||||||||||||||||||||||||||||||||||||||||||
| Kennedy | Jul 20-Oct 19, 1963 | 58.7 | 3 | ||||||||||||||||||||||||||||||||||||||||||||||||||||||||||||||||||||||||||||||||||||||||||||||||
| Nixon | Jul 20-Oct 19, 1971 | 50.5 | 2 | ||||||||||||||||||||||||||||||||||||||||||||||||||||||||||||||||||||||||||||||||||||||||||||||||
| Carter | Jul 20-Oct 19, 1979 | 31.4 | 7 | ||||||||||||||||||||||||||||||||||||||||||||||||||||||||||||||||||||||||||||||||||||||||||||||||
| Reagan | Jul 20-Oct 19, 1983 | 44.4 | 8 | ||||||||||||||||||||||||||||||||||||||||||||||||||||||||||||||||||||||||||||||||||||||||||||||||
| G.H.W. Bush | Jul 20-Oct 19, 1991 | 68.6 | 10 | ||||||||||||||||||||||||||||||||||||||||||||||||||||||||||||||||||||||||||||||||||||||||||||||||
| Clinton | Jul 20-Oct 19, 1995 | 46.4 | 8 | ||||||||||||||||||||||||||||||||||||||||||||||||||||||||||||||||||||||||||||||||||||||||||||||||
| G.W. Bush | Jul 20-Oct 19, 2003 | 55.7 | 7 | ||||||||||||||||||||||||||||||||||||||||||||||||||||||||||||||||||||||||||||||||||||||||||||||||
| Obama | Jul 20-Oct 19, 2011 | 41.0 | 90 | ||||||||||||||||||||||||||||||||||||||||||||||||||||||||||||||||||||||||||||||||||||||||||||||||
| Trump | Jul 20-Oct 19, 2019 | 40.7 | 6 | ||||||||||||||||||||||||||||||||||||||||||||||||||||||||||||||||||||||||||||||||||||||||||||||||
| Gallup | |||||||||||||||||||||||||||||||||||||||||||||||||||||||||||||||||||||||||||||||||||||||||||||||||||
It is certainly notable that three of the previous four presidents with sub-50% approval ratings in their 11th quarter were re-elected roughly a year later. Historically, presidents with job approval ratings near 50% are good bets for re-election, and Reagan, Clinton and Obama managed to get to 50% approval in the year preceding the election.
Reagan and Clinton's Ratings Were Already Improving in 11th Quarter
By the 11th quarter in their terms, Reagan and Clinton had improved after they registered approval ratings near 40% earlier in their first terms. They continued to show improvement between the 11th quarter and Election Day of the following year.
Obama's 41.0% average in his 11th quarter marked the low point of his first term. Subsequently, he showed modest improvement each quarter until he registered 52% approval in the final survey before the 2012 election.
Trump hopes to follow a path similar to Obama's. However, if Trump were to get into the range where re-election seems likely, he would have to register approval ratings he has yet to achieve in his presidency. To date, his highest approval rating has been 46%, and getting near the 50% mark will be especially challenging with Democratic opinion of him entrenched in the single digits and his approval among independents rarely exceeding 40%.
Explore President Trump's approval ratings and compare them with those of past presidents in the Gallup Presidential Job Approval Center.
Learn more about how the Gallup Poll Social Series works.


