WASHINGTON, D.C. -- Eighty-one percent of U.S. adults say their lives have been disrupted either a great deal (33%) or a fair amount (48%) by the coronavirus situation. The percentage experiencing at least a fair amount of disruption has increased from 56% in March 13-15 interviewing. Most of the change occurred between the first and second week of polling, with little movement since then.
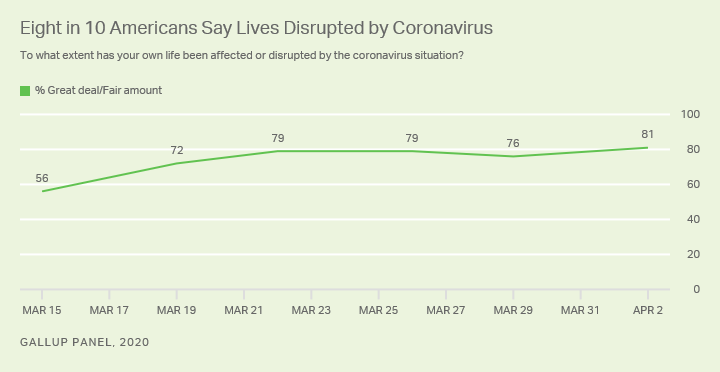
Clearly, the shutdowns in schools and non-essential businesses, as well as social distancing recommendations, have affected nearly every American -- just 1% say their lives have not been disrupted at all.
The latest figures are based on March 30-April 2 online interviews with members of Gallup's randomly selected national panel.
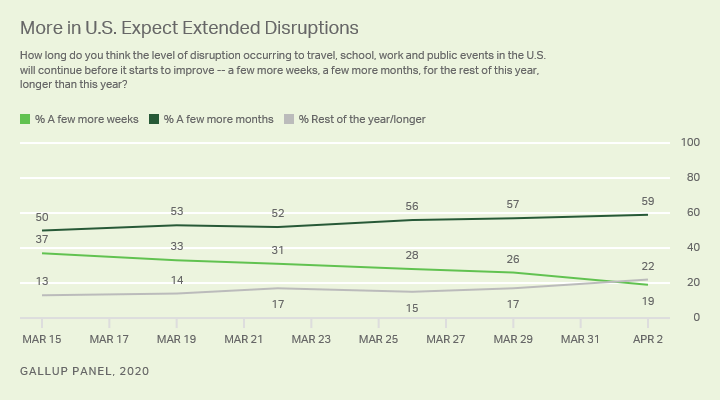
Americans expect the disruptions to continue for longer than they did in mid-March. Currently, 19% believe the disruptions will continue for "a few more weeks," down from 37% in March 13-15 polling. Twenty-two percent -- up from 13% -- expect them to last the rest of the year or longer. The majority of 59% expect disruptions to last a few more months.
Age and education status are major differentiators in the extent to which Americans' lives have been disrupted. Younger adults and college graduates are more likely to say so than older adults and college nongraduates. Still, at least seven in 10 older Americans and college nongraduates report significant disruptions in their lives.
| A great deal | A fair amount | A great deal/fair amount | ||||||||||||||||||||||||||||||||||||||||||||||||||||||||||||||||||||||||||||||||||||||||||||||||||
|---|---|---|---|---|---|---|---|---|---|---|---|---|---|---|---|---|---|---|---|---|---|---|---|---|---|---|---|---|---|---|---|---|---|---|---|---|---|---|---|---|---|---|---|---|---|---|---|---|---|---|---|---|---|---|---|---|---|---|---|---|---|---|---|---|---|---|---|---|---|---|---|---|---|---|---|---|---|---|---|---|---|---|---|---|---|---|---|---|---|---|---|---|---|---|---|---|---|---|---|---|
| % | % | % | ||||||||||||||||||||||||||||||||||||||||||||||||||||||||||||||||||||||||||||||||||||||||||||||||||
| Age | ||||||||||||||||||||||||||||||||||||||||||||||||||||||||||||||||||||||||||||||||||||||||||||||||||||
| 18-44 years | 41 | 45 | 86 | |||||||||||||||||||||||||||||||||||||||||||||||||||||||||||||||||||||||||||||||||||||||||||||||||
| 45-64 years | 30 | 50 | 80 | |||||||||||||||||||||||||||||||||||||||||||||||||||||||||||||||||||||||||||||||||||||||||||||||||
| 65+ years | 24 | 49 | 73 | |||||||||||||||||||||||||||||||||||||||||||||||||||||||||||||||||||||||||||||||||||||||||||||||||
| College graduate | ||||||||||||||||||||||||||||||||||||||||||||||||||||||||||||||||||||||||||||||||||||||||||||||||||||
| Yes | 41 | 47 | 88 | |||||||||||||||||||||||||||||||||||||||||||||||||||||||||||||||||||||||||||||||||||||||||||||||||
| No | 29 | 49 | 78 | |||||||||||||||||||||||||||||||||||||||||||||||||||||||||||||||||||||||||||||||||||||||||||||||||
| Annual household income | ||||||||||||||||||||||||||||||||||||||||||||||||||||||||||||||||||||||||||||||||||||||||||||||||||||
| Less than $36,000 | 36 | 40 | 76 | |||||||||||||||||||||||||||||||||||||||||||||||||||||||||||||||||||||||||||||||||||||||||||||||||
| $36,000-<$90,000 | 33 | 48 | 81 | |||||||||||||||||||||||||||||||||||||||||||||||||||||||||||||||||||||||||||||||||||||||||||||||||
| $90,000 or more | 34 | 50 | 84 | |||||||||||||||||||||||||||||||||||||||||||||||||||||||||||||||||||||||||||||||||||||||||||||||||
| Employed | ||||||||||||||||||||||||||||||||||||||||||||||||||||||||||||||||||||||||||||||||||||||||||||||||||||
| Yes | 34 | 49 | 83 | |||||||||||||||||||||||||||||||||||||||||||||||||||||||||||||||||||||||||||||||||||||||||||||||||
| No | 32 | 45 | 77 | |||||||||||||||||||||||||||||||||||||||||||||||||||||||||||||||||||||||||||||||||||||||||||||||||
| Parent of child under age 18 | ||||||||||||||||||||||||||||||||||||||||||||||||||||||||||||||||||||||||||||||||||||||||||||||||||||
| Yes | 38 | 49 | 87 | |||||||||||||||||||||||||||||||||||||||||||||||||||||||||||||||||||||||||||||||||||||||||||||||||
| No | 31 | 48 | 79 | |||||||||||||||||||||||||||||||||||||||||||||||||||||||||||||||||||||||||||||||||||||||||||||||||
| Gallup Panel, March 30-April 2, 2020 | ||||||||||||||||||||||||||||||||||||||||||||||||||||||||||||||||||||||||||||||||||||||||||||||||||||
Learn more about how the Gallup Panel works.