Story Highlights
- 34% say their mental health is excellent, down from 43% in 2019
- Democrats, frequent churchgoers show least mental health change
- Reports of physical health stable, slightly more positive than mental health
WASHINGTON, D.C. -- Americans' latest assessment of their mental health is worse than it has been at any point in the last two decades. Seventy-six percent of U.S. adults rate their mental health positively, representing a nine-point decline from 2019.
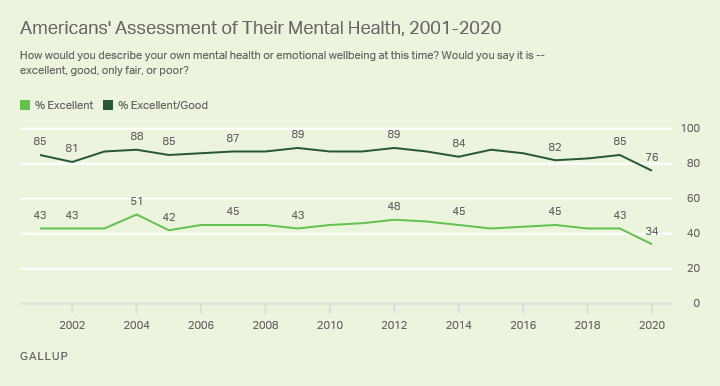
Line graph. Americans' assessment of their mental health as excellent and excellent/good since 2001. The latest data shows nine-point drops in each since 2019.
Each year since 2001, Gallup has asked Americans as part of its November Health and Healthcare survey to say whether their own mental or emotional wellbeing is excellent, good, only fair or poor. The reading for those rating their mental health as excellent or good ranged from 81% to 89% until this year's 76%.
Although the majority of U.S. adults continue to rate their mental health as excellent (34%) or good (42%), and far fewer say it is only fair (18%) or poor (5%), the latest excellent ratings are eight points lower than Gallup has measured in any prior year.
The latest weakening in positive ratings, from a Nov. 5-19 poll, are undoubtedly influenced by the coronavirus pandemic, which continues to profoundly disrupt people's lives, but may also reflect views of the election and the state of race relations, both of which were on Americans' minds this year.
Previous research from Gallup's ongoing COVID-19 tracking survey in April found that although majorities of Americans said they could continue following social distancing guidelines as long as necessary before their physical health and financial situation suffered, less than half said the same of their mental health. Additionally, in April, U.S. adults' life evaluations fell to a low point last seen during the Great Recession.
The drop in Americans' positive appraisal of their mental and emotional wellbeing varies across demographic subgroups. The following groups' ratings of their mental health as excellent fell by double digits since 2019 -- women, Republicans, independents, those who attend religious services less than weekly, White adults, those who are unmarried, older adults, and lower-income Americans. Democrats and frequent church attendees show the least change in their mental health ratings.
The subgroups showing the greatest declines in excellent mental health are not necessarily the groups with the lowest positive ratings. That is, more Republicans and independents than Democrats say their mental health is excellent while women rate theirs less positively than men.
In addition to women and Democrats, lower-income Americans, young adults, the unmarried, and those who seldom or never attend religious services have the lowest excellent ratings. These demographic patterns have been mostly consistent over the past 20 years.
| 2019 | 2020 | Change | ||||||||||||||||||||||||||||||||||||||||||||||||||||||||||||||||||||||||||||||||||||||||||||||||||
|---|---|---|---|---|---|---|---|---|---|---|---|---|---|---|---|---|---|---|---|---|---|---|---|---|---|---|---|---|---|---|---|---|---|---|---|---|---|---|---|---|---|---|---|---|---|---|---|---|---|---|---|---|---|---|---|---|---|---|---|---|---|---|---|---|---|---|---|---|---|---|---|---|---|---|---|---|---|---|---|---|---|---|---|---|---|---|---|---|---|---|---|---|---|---|---|---|---|---|---|---|
| % | % | pct. pts. | ||||||||||||||||||||||||||||||||||||||||||||||||||||||||||||||||||||||||||||||||||||||||||||||||||
| Gender | ||||||||||||||||||||||||||||||||||||||||||||||||||||||||||||||||||||||||||||||||||||||||||||||||||||
| Male | 49 | 41 | -8 | |||||||||||||||||||||||||||||||||||||||||||||||||||||||||||||||||||||||||||||||||||||||||||||||||
| Female | 37 | 27 | -10 | |||||||||||||||||||||||||||||||||||||||||||||||||||||||||||||||||||||||||||||||||||||||||||||||||
| Party identification | ||||||||||||||||||||||||||||||||||||||||||||||||||||||||||||||||||||||||||||||||||||||||||||||||||||
| Republican | 56 | 41 | -15 | |||||||||||||||||||||||||||||||||||||||||||||||||||||||||||||||||||||||||||||||||||||||||||||||||
| Independent | 44 | 32 | -11 | |||||||||||||||||||||||||||||||||||||||||||||||||||||||||||||||||||||||||||||||||||||||||||||||||
| Democrat | 30 | 29 | -1 | |||||||||||||||||||||||||||||||||||||||||||||||||||||||||||||||||||||||||||||||||||||||||||||||||
| Religious service attendance | ||||||||||||||||||||||||||||||||||||||||||||||||||||||||||||||||||||||||||||||||||||||||||||||||||||
| Weekly | 42 | 46 | +4 | |||||||||||||||||||||||||||||||||||||||||||||||||||||||||||||||||||||||||||||||||||||||||||||||||
| Nearly weekly/Monthly | 47 | 35 | -12 | |||||||||||||||||||||||||||||||||||||||||||||||||||||||||||||||||||||||||||||||||||||||||||||||||
| Seldom/Never | 42 | 29 | -13 | |||||||||||||||||||||||||||||||||||||||||||||||||||||||||||||||||||||||||||||||||||||||||||||||||
| Race | ||||||||||||||||||||||||||||||||||||||||||||||||||||||||||||||||||||||||||||||||||||||||||||||||||||
| White | 45 | 35 | -10 | |||||||||||||||||||||||||||||||||||||||||||||||||||||||||||||||||||||||||||||||||||||||||||||||||
| Non-White | 40 | 32 | -8 | |||||||||||||||||||||||||||||||||||||||||||||||||||||||||||||||||||||||||||||||||||||||||||||||||
| Marital status | ||||||||||||||||||||||||||||||||||||||||||||||||||||||||||||||||||||||||||||||||||||||||||||||||||||
| Married | 49 | 41 | -8 | |||||||||||||||||||||||||||||||||||||||||||||||||||||||||||||||||||||||||||||||||||||||||||||||||
| Not married | 37 | 27 | -10 | |||||||||||||||||||||||||||||||||||||||||||||||||||||||||||||||||||||||||||||||||||||||||||||||||
| Age group | ||||||||||||||||||||||||||||||||||||||||||||||||||||||||||||||||||||||||||||||||||||||||||||||||||||
| 18-29 | 37 | 28 | -9 | |||||||||||||||||||||||||||||||||||||||||||||||||||||||||||||||||||||||||||||||||||||||||||||||||
| 30-49 | 40 | 32 | -8 | |||||||||||||||||||||||||||||||||||||||||||||||||||||||||||||||||||||||||||||||||||||||||||||||||
| 50-64 | 51 | 42 | -9 | |||||||||||||||||||||||||||||||||||||||||||||||||||||||||||||||||||||||||||||||||||||||||||||||||
| 65+ | 44 | 34 | -10 | |||||||||||||||||||||||||||||||||||||||||||||||||||||||||||||||||||||||||||||||||||||||||||||||||
| Household income group | ||||||||||||||||||||||||||||||||||||||||||||||||||||||||||||||||||||||||||||||||||||||||||||||||||||
| Under $40,000 | 33 | 27 | -6 | |||||||||||||||||||||||||||||||||||||||||||||||||||||||||||||||||||||||||||||||||||||||||||||||||
| $40,000-$99,999 | 43 | 31 | -12 | |||||||||||||||||||||||||||||||||||||||||||||||||||||||||||||||||||||||||||||||||||||||||||||||||
| $100,000 or more | 57 | 45 | -12 | |||||||||||||||||||||||||||||||||||||||||||||||||||||||||||||||||||||||||||||||||||||||||||||||||
| GALLUP | ||||||||||||||||||||||||||||||||||||||||||||||||||||||||||||||||||||||||||||||||||||||||||||||||||||
Americans' Physical Health Holding Up Better Than Their Mental Health
While Americans' mental health has suffered this year, their self-reported physical health has not changed substantially. In fact, the latest 29% excellent reading and the combined 79% excellent/good rating are similar to a year ago and close to the averages for the 20-year trend.
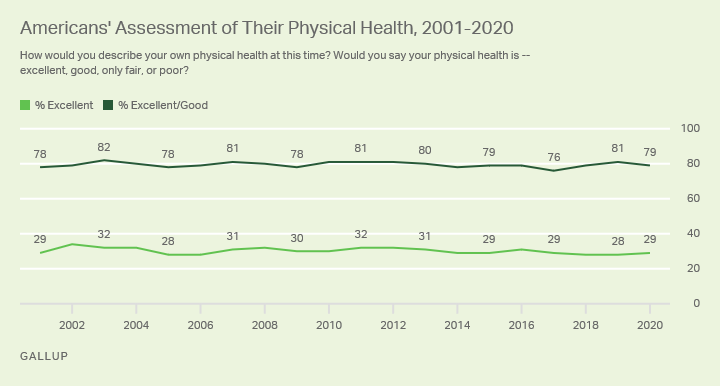
Line graph. Americans' assessment of their physical health as excellent and excellent/good since 2001. The latest data shows 29% say it is excellent, and 79% say it is excellent or good.
As has been the case in prior years, Americans' age is a strong predictor of how they rate their physical health -- with older Americans less positive than younger Americans. Similarly, there are recurring and significant differences based on income and education levels. Those with more education and higher incomes, who likely have better access to quality healthcare, have more positive assessments of their physical health than their counterparts.
| Excellent | Good | Excellent/Good | ||||||||||||||||||||||||||||||||||||||||||||||||||||||||||||||||||||||||||||||||||||||||||||||||||
|---|---|---|---|---|---|---|---|---|---|---|---|---|---|---|---|---|---|---|---|---|---|---|---|---|---|---|---|---|---|---|---|---|---|---|---|---|---|---|---|---|---|---|---|---|---|---|---|---|---|---|---|---|---|---|---|---|---|---|---|---|---|---|---|---|---|---|---|---|---|---|---|---|---|---|---|---|---|---|---|---|---|---|---|---|---|---|---|---|---|---|---|---|---|---|---|---|---|---|---|---|
| % | % | % | ||||||||||||||||||||||||||||||||||||||||||||||||||||||||||||||||||||||||||||||||||||||||||||||||||
| Age group | ||||||||||||||||||||||||||||||||||||||||||||||||||||||||||||||||||||||||||||||||||||||||||||||||||||
| 18-29 | 37 | 47 | 84 | |||||||||||||||||||||||||||||||||||||||||||||||||||||||||||||||||||||||||||||||||||||||||||||||||
| 30-49 | 32 | 49 | 81 | |||||||||||||||||||||||||||||||||||||||||||||||||||||||||||||||||||||||||||||||||||||||||||||||||
| 50-64 | 27 | 50 | 77 | |||||||||||||||||||||||||||||||||||||||||||||||||||||||||||||||||||||||||||||||||||||||||||||||||
| 65+ | 18 | 55 | 73 | |||||||||||||||||||||||||||||||||||||||||||||||||||||||||||||||||||||||||||||||||||||||||||||||||
| Annual household income | ||||||||||||||||||||||||||||||||||||||||||||||||||||||||||||||||||||||||||||||||||||||||||||||||||||
| Less than $40,000 | 23 | 42 | 65 | |||||||||||||||||||||||||||||||||||||||||||||||||||||||||||||||||||||||||||||||||||||||||||||||||
| $40,000-Less than $100,000 | 27 | 59 | 86 | |||||||||||||||||||||||||||||||||||||||||||||||||||||||||||||||||||||||||||||||||||||||||||||||||
| $100,000 or more | 40 | 46 | 86 | |||||||||||||||||||||||||||||||||||||||||||||||||||||||||||||||||||||||||||||||||||||||||||||||||
| Education | ||||||||||||||||||||||||||||||||||||||||||||||||||||||||||||||||||||||||||||||||||||||||||||||||||||
| No college degree | 25 | 51 | 76 | |||||||||||||||||||||||||||||||||||||||||||||||||||||||||||||||||||||||||||||||||||||||||||||||||
| College graduate | 37 | 49 | 86 | |||||||||||||||||||||||||||||||||||||||||||||||||||||||||||||||||||||||||||||||||||||||||||||||||
| GALLUP, Nov. 5-19, 2020 | ||||||||||||||||||||||||||||||||||||||||||||||||||||||||||||||||||||||||||||||||||||||||||||||||||||
Bottom Line
More than eight months into the coronavirus pandemic in the U.S., Americans' reports of mental health are much worse than a year ago. While they remain more likely to say their mental health is excellent than their physical health, the gap between the two has narrowed this year.
View complete question responses and trends (PDF download).
Learn more about how the Gallup Poll Social Series works.