
Story Highlights
- Percentage who are "thriving" continues to decline, reaching previous low
- Current life satisfaction continues to erode as anticipated life edges up
- Significant daily stress and worry remain near record highs
WASHINGTON, D.C. -- The percentage of U.S. adults who evaluate their lives well enough to be considered "thriving" has dropped to 46.4%, matching the low point measured in November 2008 during the Great Recession. Today's thriving rate has worsened about three percentage points since the first half of March and nearly 10 points since the spring of 2019.
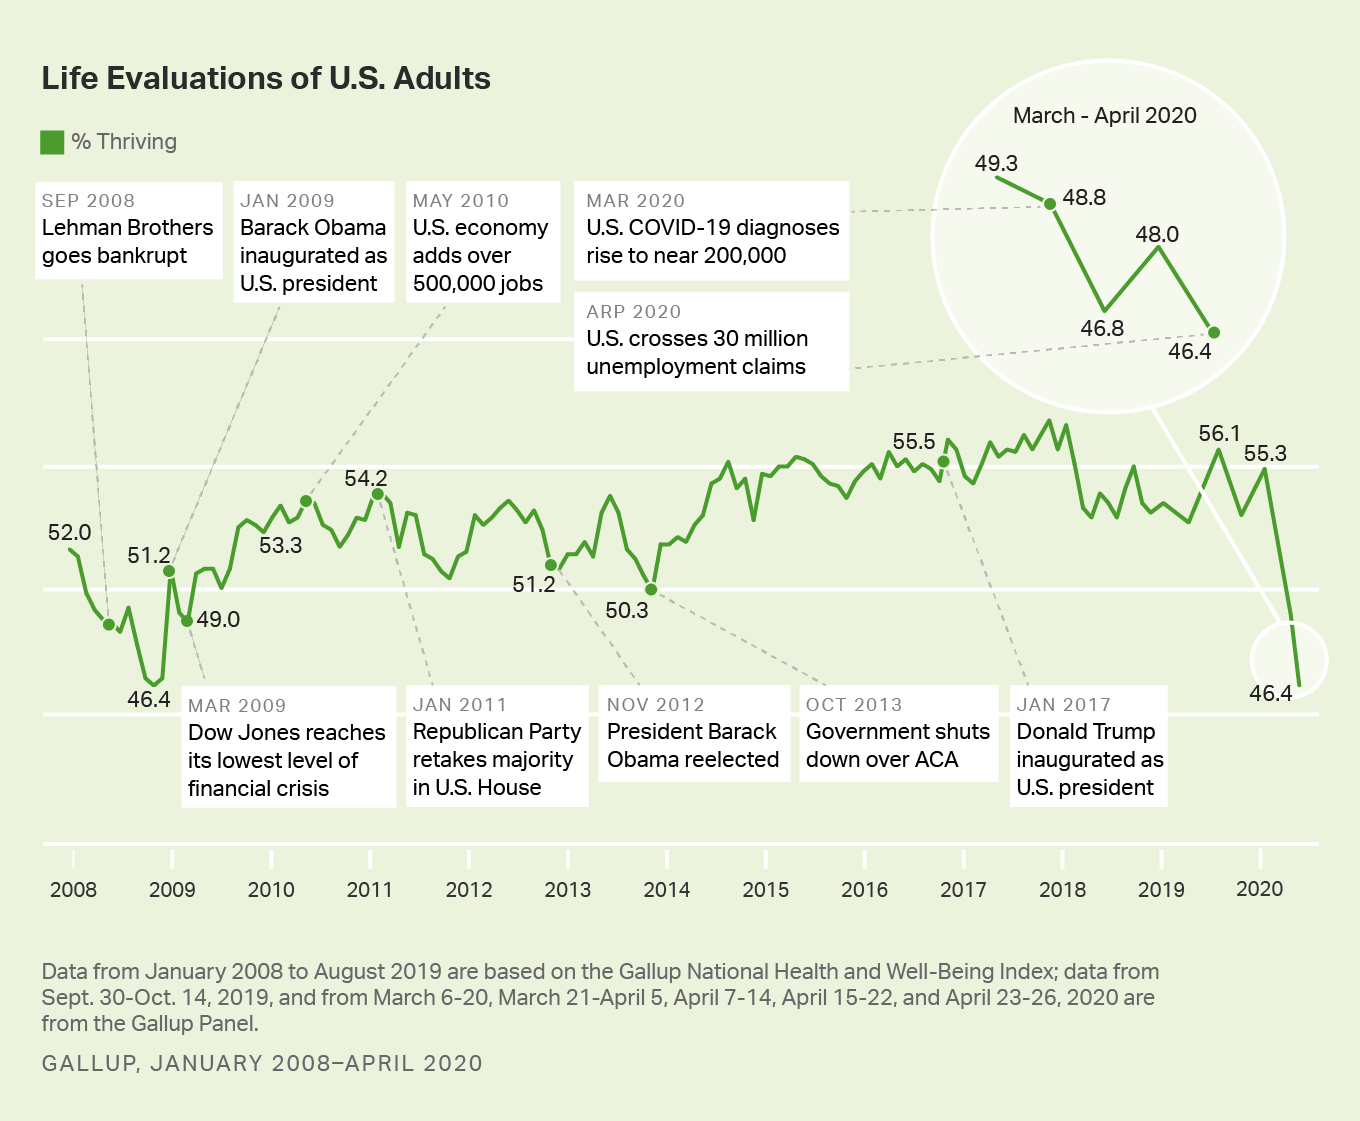
Gallup classifies Americans as "thriving," "struggling" or "suffering" according to how they rate their current and future lives on a ladder scale with steps numbered from 0 to 10, based on the Cantril Self-Anchoring Striving Scale. Those who rate their current life a seven or higher and their anticipated life in five years an eight or higher are classified as thriving.
The most recent results, captured April 23-26, 2020, are based on 4,357 completed surveys with respondents randomly selected from the Gallup Panel, a scientifically populated, non-opt-in panel of about 80,000 adults across all 50 states and the District of Columbia. Other results dating to Sept. 30-Oct.14, 2019 were also from the Gallup Panel, while all previous estimates are based on samples from the Gallup National Health and Well-Being Index. Comparisons of national estimates that occurred at close to the same time in 2019 showed highly similar results between the two surveys demonstrating their comparability.
In 2008, the first full year of the Great Recession, the thriving percentage fell from 52.0% in January to its low of 46.4% ten months later, a 5.6 percentage point decline. The current decline -- occurring over about the same amount of time -- is nearly double this amount, erasing 11 years of steady (albeit uneven) improvement in how Americans evaluate their lives.
Current Life Satisfaction Continues to Erode
Between last fall and March 21-April 5, the percentages of respondents rating their current life a "7" or higher dropped by 9.5 points to 58.2% with a decline that was similar across age groups. Ratings of anticipated lives in the future, in contrast, improved slightly. New results have extended these patterns, widening the gap still further between how Americans rate the current lives compared with how they think their lives will be in five years.
| Sep. 30 to Oct. 14, 2019 | Mar. 21 to Apr. 5, 2020 | Apr. 20-26, 2020 | Change | ||||||||||||||||||||||||||||||||||||||||||||||||||||||||||||||||||||||||||||||||||||||||||||||||
|---|---|---|---|---|---|---|---|---|---|---|---|---|---|---|---|---|---|---|---|---|---|---|---|---|---|---|---|---|---|---|---|---|---|---|---|---|---|---|---|---|---|---|---|---|---|---|---|---|---|---|---|---|---|---|---|---|---|---|---|---|---|---|---|---|---|---|---|---|---|---|---|---|---|---|---|---|---|---|---|---|---|---|---|---|---|---|---|---|---|---|---|---|---|---|---|---|---|---|---|
| % | % | % | (pct. pts.) | ||||||||||||||||||||||||||||||||||||||||||||||||||||||||||||||||||||||||||||||||||||||||||||||||
| Current life satisfaction (7-10) | 67.7 | 58.2 | 56.9 | -10.8 | |||||||||||||||||||||||||||||||||||||||||||||||||||||||||||||||||||||||||||||||||||||||||||||||
| Anticipated life satisfaction (8-10) | 65.5 | 68.0 | 68.9 | +3.4 | |||||||||||||||||||||||||||||||||||||||||||||||||||||||||||||||||||||||||||||||||||||||||||||||
| Gallup Panel | |||||||||||||||||||||||||||||||||||||||||||||||||||||||||||||||||||||||||||||||||||||||||||||||||||
Significant Daily Stress, Worry Sustain Historic Increases
The percentage of people experiencing significant stress and worry the day before -- typically very stable rates -- experienced unprecedented increases in the first half of March with stress rising 14 percentage points to 60% and worry rising 20 points to 58%. In practical terms, about 51 million more adults were suffering significant worry in late March/early April than were experiencing the same emotion back in August/September. These results have since improved slightly since, and then leveled off in four subsequent measurements, but remain much higher than pre-COVID levels. The sustained levels of emotional anxiety are likely continuing to play a role in the ongoing erosion of current life satisfaction that, in turn, has caused the thriving percentage to suffer such a significant decline.
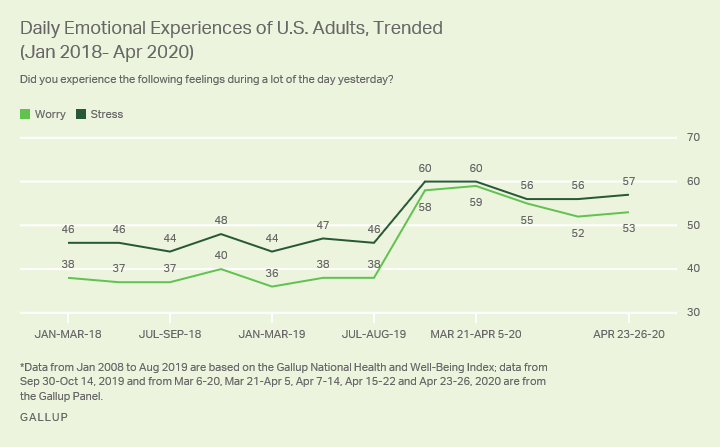
Unlike the changes in general life ratings, which have disproportionately impacted younger adults, increases in daily worry and stress are similar across all age groups.
Implications
U.S. adults' life evaluations have now matched historic lows last measured in the heart of the Great Recession. The near 10-point decline in the percentage of U.S. adults who are thriving -- representing close to 25 million people -- approximates the number who have filed for unemployment benefits before the end of April as a result of economic collapse caused by the COVID-19 pandemic.
Changes of this magnitude in life ratings are rare and typically signify major events. In 2010, at the onset of the Arab Uprising, Tunisians reported a 10-point decline in thriving over a two-year span before the end of Zine El Abidine Ben Ali's rule. Three years later, the percentage of Egyptians who were "suffering" shot up 11 points in the runup to President Mohamed Morsi's ouster. Gallup also reported a 10-point decline in the percentage thriving in Ukraine before the 2013 Euromaidan revolution and a 15-point drop in the percentage thriving in the U.K. prior to the 2016 Brexit vote.
The decline in the percentage of U.S. adults who are thriving is entirely explained by declines in their evaluations of current lives, with small improvements measured in anticipated wellbeing in the next five years (perhaps in part a result of the plunge in current life ratings). However, as the coronavirus pandemic stretches on and models regarding COVID-19 worsen, optimism for the future may also begin to erode. If this occurs, a second wave in the decline of the percentage who are thriving in the U.S. could ensue.
The difference between how the COVID-19 pandemic influences what we experience on any given day compared with how we assess our lives more broadly also continues to be on display. The unprecedented increases in daily worry and stress last month have now narrowly mitigated, perhaps a reflection of some relief in anxiety as the new normal of social isolation policies settles in. But the still sharply elevated levels of experiencing stress and worry each day likely continue to erode general satisfaction with current lives still further. The current magnitude of the change in daily experiences is much larger than what Gallup observed in 2008, when daily worry and stress increased by five and three points, respectively, during the Great Recession. Nearly two years passed before these negative emotions returned to early 2008 levels.
Learn more about how the Gallup National Health and Well-Being Index works.
Learn more about how the Gallup Panel works.