Story Highlights
- Democrats maintain edge in party affiliation, 48% to 43%
- Preferences shifted over course of the year
- Slight reduction in independent identifiers, typical in an election year
WASHINGTON, D.C. -- Forty-eight percent of U.S. adults on average in 2020 identified as Democrats or were independents who leaned toward the Democratic Party, while 43% were Republicans or Republican-leaning independents. The five-point Democratic advantage is consistent with the partisan balance Gallup measured over the previous four years, and is similar to the average four-point Democratic advantage (47% to 43%) over the past two decades.

Line graph. On average in 2020, 48% of Americans were Democrats and Democratic leaners, and 43% were Republicans and Republican leaners, generally in line with what Gallup has measured since 2012.
The results are based on an aggregate of 2020 Gallup polls, which included interviews with more than 19,000 U.S. adults.
In each survey, Gallup asks respondents whether they identify politically as a Republican, a Democrat or an independent. All independents are then asked whether they lean more to the Democratic Party or the Republican Party. Gallup has routinely asked these questions since 1991.
Overall, in 2020, 30% of Americans identified as Democrats, 18% were Democratic-leaning independents, 29% identified as Republicans and 14% were Republican-leaning independents. Seven percent of independents did not express a partisan leaning. Thus, most of Democrats' five-percentage-point advantage comes from independents leaning to their party rather than from Americans identifying outright as Democrats.
Although more Americans typically align with the Democratic Party than the Republican Party when party identification and leaning are combined, the size of that advantage has varied over time, but it has mostly been in single digits. Democrats did enjoy double-digit advantages between 2006 and 2008, the latter years of the George W. Bush administration, when his approval ratings were low amid the prolonged Iraq War and economic challenges, including record-high gas prices, the bursting of the housing bubble and for much of the Great Recession.
Party preferences were evenly divided in three years: 2002, 2003 and 2011. In 2002 and 2003, Bush enjoyed high approval ratings for his leadership after the 9/11 terrorist attacks and initial success in the war against Iraq. The 2011 figures came after major Republican victories in the 2010 midterms, which gave the party control of the House of Representatives.
The sole year showing a Republican advantage was 1991, when Republican President George H.W. Bush successfully led the multinational Persian Gulf War effort, and his approval rating soared to a then-record high.
Party Preferences Varied During 2020
Even though average U.S. party preferences in 2020 were similar to those in prior years, they showed considerable movement during the course of the year. Early in 2020, when Americans' economic confidence was the best in two decades, President Donald Trump was acquitted in the Senate impeachment trial and the coronavirus pandemic was only beginning to take hold in the U.S., Americans' party preferences were about evenly split. During the first quarter of 2020, an average of 45% of Americans were Republicans or Republican leaners and 45% Democrats or Democratic leaners. In the subsequent quarters of 2020, Democrats averaged a six-point advantage.
Democrats' advantage stretched to double digits twice in 2020 -- in June, as widespread racial justice protests occurred in response to the death of George Floyd, and in December, as coronavirus infections and deaths surged to record levels in the U.S. and Trump continued to challenge the outcome of the presidential election.
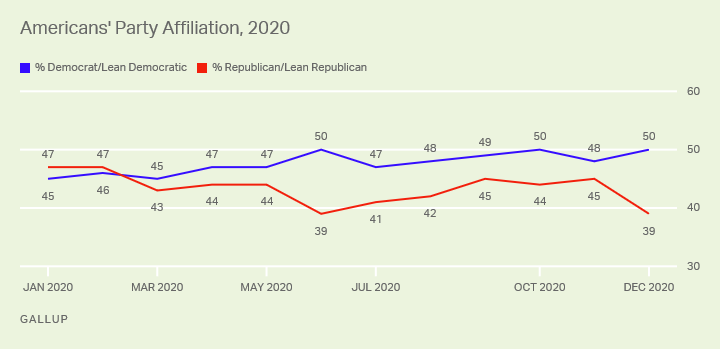
Line graph. The gap in party preferences each month in 2020 varied from a two-point Republican advantage in January to 11-point Democratic advantages in July and December. In most months, Democrats held a lead of three to six points.
Independent Identification Falls
The 39% of U.S. adults identifying as political independents -- regardless of their political leanings -- in 2020 is down from 42% in 2018 and 41% in 2019. A decline in independent identification is typical in presidential election years, having occurred in all such years in the past three decades except 1992 and 2012. The declines have usually been between three and five points compared with the year before the election, so the two-point decline this past year is smaller than normal.
Even with the modest decline, Americans remain more likely to identify as independents than they were in most years between 1988 and 2010, when the percentage never exceeded 39%. Since 2011, the percentage has been 40% or higher, except for 2016 and 2020.
Republican identification has ticked up three points over the past two years after falling to 26% in 2018, just one point above the record low from 2013.
Democratic party identification has been quite steady for the past decade, ranging only between 29% and 31% since 2010. The two 29% figures represent the low points in Democratic identification, with the highs being 36% in 1988 and 2008.
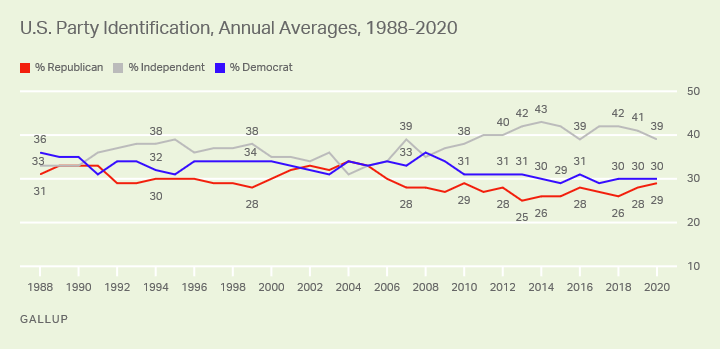
Line graph. Thirty-nine percent of U.S. adults identified as political independents in 2020, down slightly from 41% in 2019, but remaining higher than all years before 2010. Republican identification has inched up to 29% over the past two years, while Democratic identification has been stable, but lower than it was before 2009.
Bottom Line
Last year featured a number of momentous events, and Americans' party preferences shifted in response to some of these. In the end, support for the two major parties averaged out to be essentially the same as it had been in prior years, with Democrats maintaining a modest edge. Democrats' five-point advantage in party affiliation was also similar to the 4.4-percentage-point margin for Joe Biden over Trump in the U.S. presidential election popular vote.
The Democratic edge in party affiliation is largely the result of more independents -- the largest U.S. political group -- leaning toward the Democratic Party than the Republican Party. This suggests the Democratic edge is somewhat fragile, so that if the party shifts significantly leftward in its policies or rhetoric, its advantage could shrink or even disappear as it has at times in the past.
Learn more about how the Gallup Poll Social Series works.