Story Highlights
- 73% worry about the availability and affordability of energy
- Up from 54% last year
- Majority says U.S. will face critical energy shortage in next five years
WASHINGTON, D.C. -- Americans' worry about the U.S. energy situation has risen sharply in the past year to a level not seen in nearly a decade. More than seven in 10 U.S. adults, up from about half last year, say they worry about the availability and affordability of energy. Additionally, Gallup has measured recent highs in the percentage describing the energy situation as being "very serious" and predicting there will be a critical energy shortage in the next five years. Americans prefer the U.S. put more emphasis on developing energy from wind and solar power and less emphasis on production from coal.
The March 1-15 survey was conducted amid a steady increase in gas prices, and shortly after two major energy crises in U.S. states. In February, millions of Texas residents went without power for several days when extreme cold weather disrupted energy production in that state. Last August, California instituted rolling blackouts as that state struggled to keep up with energy demand during a period of excessive heat and a series of wildfires.
Surge in Worry About Energy Availability and Affordability
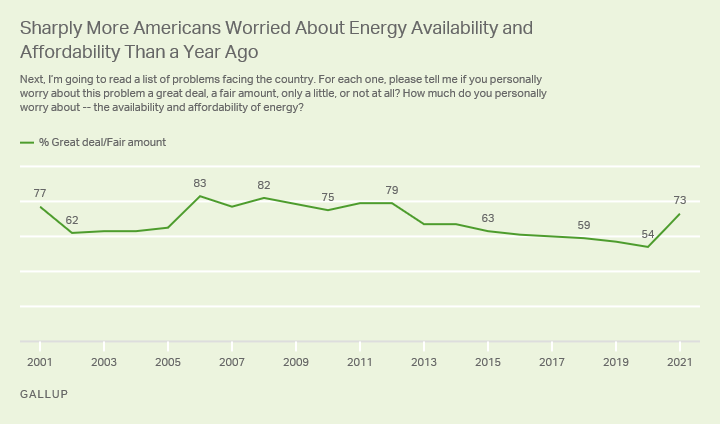
Seventy-three percent of U.S. adults say they worry "a great deal" (37%) or "a fair amount" (36%) about the availability and affordability of energy. This is up 19 percentage points from last year -- the low point in Gallup's trend -- and is the highest since 2012 when 79% were worried. More than eight in 10 Americans were worried about energy in 2006 and 2008, times of sharply rising gas prices.

Line graph. Seventy-three percent of Americans say they worry a great deal or a fair amount about the availability and affordability of energy. That is up from 54% in 2020 and the highest since 79% in 2012. The highest measured since the question was first asked in 2001 was 83% worried in 2006.
Increased worry about the availability and affordability of energy is apparent among all major subgroups. However, Republicans show a much larger surge than Democrats do, likely because of differing assessments of the energy situation with President Donald Trump in office last year. Thirty points separated Democratic and Republican worry last year, while this year, the two groups show similar levels of worry.
| 2020 | 2021 | Change | |||||||||||||||||||||||||||||||||||||||||||||||||||||||||||||||||||||||||||||||||||||||||||||||||
|---|---|---|---|---|---|---|---|---|---|---|---|---|---|---|---|---|---|---|---|---|---|---|---|---|---|---|---|---|---|---|---|---|---|---|---|---|---|---|---|---|---|---|---|---|---|---|---|---|---|---|---|---|---|---|---|---|---|---|---|---|---|---|---|---|---|---|---|---|---|---|---|---|---|---|---|---|---|---|---|---|---|---|---|---|---|---|---|---|---|---|---|---|---|---|---|---|---|---|---|
| % | % | pct. pts. | |||||||||||||||||||||||||||||||||||||||||||||||||||||||||||||||||||||||||||||||||||||||||||||||||
| All U.S. adults | 54 | 73 | +19 | ||||||||||||||||||||||||||||||||||||||||||||||||||||||||||||||||||||||||||||||||||||||||||||||||
| Republicans | 38 | 77 | +39 | ||||||||||||||||||||||||||||||||||||||||||||||||||||||||||||||||||||||||||||||||||||||||||||||||
| Independents | 56 | 69 | +13 | ||||||||||||||||||||||||||||||||||||||||||||||||||||||||||||||||||||||||||||||||||||||||||||||||
| Democrats | 68 | 73 | +5 | ||||||||||||||||||||||||||||||||||||||||||||||||||||||||||||||||||||||||||||||||||||||||||||||||
| Figures are the percentage who worry "a great deal" or "a fair amount" | |||||||||||||||||||||||||||||||||||||||||||||||||||||||||||||||||||||||||||||||||||||||||||||||||||
| Gallup | |||||||||||||||||||||||||||||||||||||||||||||||||||||||||||||||||||||||||||||||||||||||||||||||||||
More in U.S. Regard Energy Situation as Very Serious
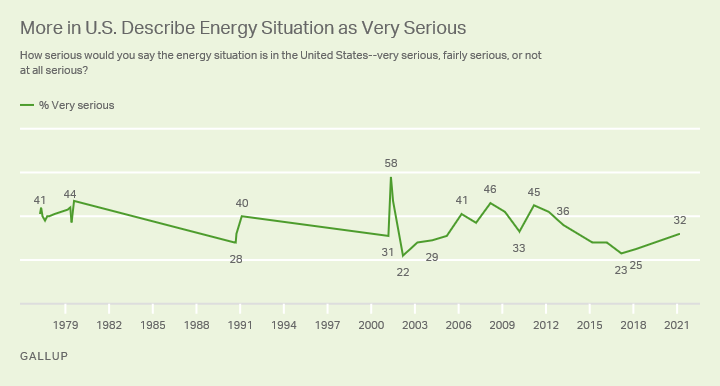
A separate question in the survey finds 32% of Americans describing the U.S. energy situation as "very serious," an increase of seven points from when the question was last asked in 2018, and a level last seen in 2014. Evaluations of the energy situation have been worse in the past, such as when gas prices were high, including in the late 1970s, in 1991 during the Persian Gulf War, and in the mid-to-late 2000s. The all-time high of 58% came in 2001 when prices for a variety of energy sources were rising, and the state of California imposed rolling blackouts on parts of the state because energy companies there were unable to keep up with the high demand for electricity.

Line graph. Thirty-two percent say the energy situation in the U.S. is very serious, up from 25% the last time it was measured in 2018. The high point was 58% in 2001, and the low was 22% in 2002. There have been several readings above 40%, including in the late 1970s, 1991, 2006, 2008 and 2009, and 2011 and 2012.
In addition to the 32% who currently describe the energy situation as very serious, 51% say it is "fairly serious" and 15% "not serious at all." Compared with 2018, the percentage saying the energy situation is fairly serious is unchanged, while there has been a seven-point decline in the percentage saying it is not serious at all.
In most subgroups, assessments of the energy situation are similar to the national average. This includes 36% of Republicans and 34% of Democrats describing the situation as very serious.
Majority Expects Critical Energy Shortage in Next Five Years
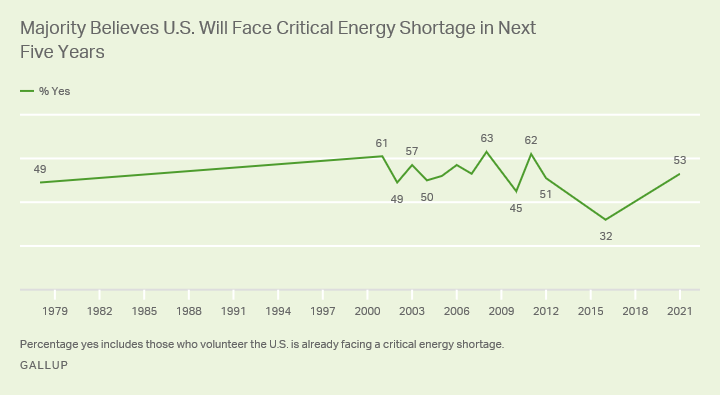
Consistent with Americans' increased concern about the energy situation in the U.S., 53% now predict the U.S. will face a critical energy shortage in the next five years. The last time Gallup asked the question, in 2016, 32% held this view, although that represented an exception to the historical trend, with majorities of Americans commonly predicting U.S. energy shortages, including more than six in 10 in 2001, 2008 and 2011.

Line graph. Fifty-three percent of U.S. adults say the U.S. is likely to face a critical energy shortage in the next five years, an increase from 32% in 2016. The high points were 61% in 2001, 63% in 2008 and 62% in 2011.
Men (46%) are less likely than women (59%), and college graduates (45%) are less likely than college non-graduates (57%) to believe there will be a critical energy shortage in the next five years.
Americans Continue to Want Greater Emphasis on Solar, Wind Power
As they have over the past eight years, most Americans prefer the U.S. put more emphasis on producing domestic energy from solar and wind power. About half want a greater emphasis on natural gas energy production, while opinions are mixed on nuclear power and oil. Close to half of Americans want less emphasis on energy derived from coal, while the remainder split between wanting increased emphasis on coal or the same level as now.
| More emphasis | Same as now | Less emphasis | |||||||||||||||||||||||||||||||||||||||||||||||||||||||||||||||||||||||||||||||||||||||||||||||||
|---|---|---|---|---|---|---|---|---|---|---|---|---|---|---|---|---|---|---|---|---|---|---|---|---|---|---|---|---|---|---|---|---|---|---|---|---|---|---|---|---|---|---|---|---|---|---|---|---|---|---|---|---|---|---|---|---|---|---|---|---|---|---|---|---|---|---|---|---|---|---|---|---|---|---|---|---|---|---|---|---|---|---|---|---|---|---|---|---|---|---|---|---|---|---|---|---|---|---|---|
| % | % | % | |||||||||||||||||||||||||||||||||||||||||||||||||||||||||||||||||||||||||||||||||||||||||||||||||
| Solar power | 73 | 17 | 10 | ||||||||||||||||||||||||||||||||||||||||||||||||||||||||||||||||||||||||||||||||||||||||||||||||
| Wind | 66 | 18 | 16 | ||||||||||||||||||||||||||||||||||||||||||||||||||||||||||||||||||||||||||||||||||||||||||||||||
| Natural gas | 49 | 33 | 19 | ||||||||||||||||||||||||||||||||||||||||||||||||||||||||||||||||||||||||||||||||||||||||||||||||
| Nuclear power | 39 | 32 | 28 | ||||||||||||||||||||||||||||||||||||||||||||||||||||||||||||||||||||||||||||||||||||||||||||||||
| Oil | 38 | 22 | 39 | ||||||||||||||||||||||||||||||||||||||||||||||||||||||||||||||||||||||||||||||||||||||||||||||||
| Coal | 23 | 28 | 48 | ||||||||||||||||||||||||||||||||||||||||||||||||||||||||||||||||||||||||||||||||||||||||||||||||
| March 1-15, 2021 | |||||||||||||||||||||||||||||||||||||||||||||||||||||||||||||||||||||||||||||||||||||||||||||||||||
| Gallup | |||||||||||||||||||||||||||||||||||||||||||||||||||||||||||||||||||||||||||||||||||||||||||||||||||
Current preferences for increased emphasis on energy production are largely similar to what Gallup found in its previous measurement in 2019. Slightly more now than in 2019 are calling for greater emphasis on oil and nuclear power, though that may merely reflect a return to prior levels after lower-than-usual readings in 2019.
Longer term, there has been a large reduction in wanting increased emphasis on natural gas production and smaller decreases in desire for greater production of coal, oil and wind power.
| 2013 | 2015 | 2019 | 2021 | Change, 2013-2021 | |||||||||||||||||||||||||||||||||||||||||||||||||||||||||||||||||||||||||||||||||||||||||||||||
|---|---|---|---|---|---|---|---|---|---|---|---|---|---|---|---|---|---|---|---|---|---|---|---|---|---|---|---|---|---|---|---|---|---|---|---|---|---|---|---|---|---|---|---|---|---|---|---|---|---|---|---|---|---|---|---|---|---|---|---|---|---|---|---|---|---|---|---|---|---|---|---|---|---|---|---|---|---|---|---|---|---|---|---|---|---|---|---|---|---|---|---|---|---|---|---|---|---|---|---|
| % | % | % | % | pct. pts. | |||||||||||||||||||||||||||||||||||||||||||||||||||||||||||||||||||||||||||||||||||||||||||||||
| Solar power | 76 | 79 | 80 | 73 | -3 | ||||||||||||||||||||||||||||||||||||||||||||||||||||||||||||||||||||||||||||||||||||||||||||||
| Wind | 71 | 70 | 70 | 66 | -5 | ||||||||||||||||||||||||||||||||||||||||||||||||||||||||||||||||||||||||||||||||||||||||||||||
| Natural gas | 65 | 55 | 46 | 49 | -16 | ||||||||||||||||||||||||||||||||||||||||||||||||||||||||||||||||||||||||||||||||||||||||||||||
| Oil | 46 | 41 | 28 | 38 | -8 | ||||||||||||||||||||||||||||||||||||||||||||||||||||||||||||||||||||||||||||||||||||||||||||||
| Nuclear power | 37 | 35 | 32 | 39 | 2 | ||||||||||||||||||||||||||||||||||||||||||||||||||||||||||||||||||||||||||||||||||||||||||||||
| Coal | 31 | 28 | 22 | 23 | -8 | ||||||||||||||||||||||||||||||||||||||||||||||||||||||||||||||||||||||||||||||||||||||||||||||
| Figures are the percentages wanting more emphasis. | |||||||||||||||||||||||||||||||||||||||||||||||||||||||||||||||||||||||||||||||||||||||||||||||||||
| Gallup | |||||||||||||||||||||||||||||||||||||||||||||||||||||||||||||||||||||||||||||||||||||||||||||||||||
Implications
Americans' energy concerns are growing at a time when gas prices are rising, and two states have recently had challenges meeting consumer demand for energy. The increased concern occurring now mirrors what Gallup had seen in the past when energy problems arose in the U.S.
The Biden administration's proposals for energy are intertwined with its desire to take action to reduce climate change. Much of that effort relies on increased use of renewable and zero-carbon emissions energy in the U.S., which aligns with the public's preference for more emphasis on solar and wind power.
If the U.S. energy situation gets worse, there will likely be increased public demand for the government to take action. With a closely divided House of Representatives and Senate, President Joe Biden would need to come up with a plan that can maintain his party's support without provoking significant opposition from Republicans or moderate Democrats.
View complete question responses and trends (PDF download).
Learn more about how the Gallup Poll Social Series works.


