
Story Highlights
- LGBT identification up from 5.6% in 2020
- One in five Gen Z adults identify as LGBT
- Bisexual identification is most common
Learn more in Gallup’s 2024 LGBTQ+ update.
WASHINGTON, D.C. -- The percentage of U.S. adults who self-identify as lesbian, gay, bisexual, transgender or something other than heterosexual has increased to a new high of 7.1%, which is double the percentage from 2012, when Gallup first measured it.
Gallup asks Americans whether they personally identify as straight or heterosexual, lesbian, gay, bisexual, or transgender as part of the demographic information it collects on all U.S. telephone surveys. Respondents can also volunteer any other sexual orientation or gender identity they prefer. In addition to the 7.1% of U.S. adults who consider themselves to be an LGBT identity, 86.3% say they are straight or heterosexual, and 6.6% do not offer an opinion. The results are based on aggregated 2021 data, encompassing interviews with more than 12,000 U.S. adults.
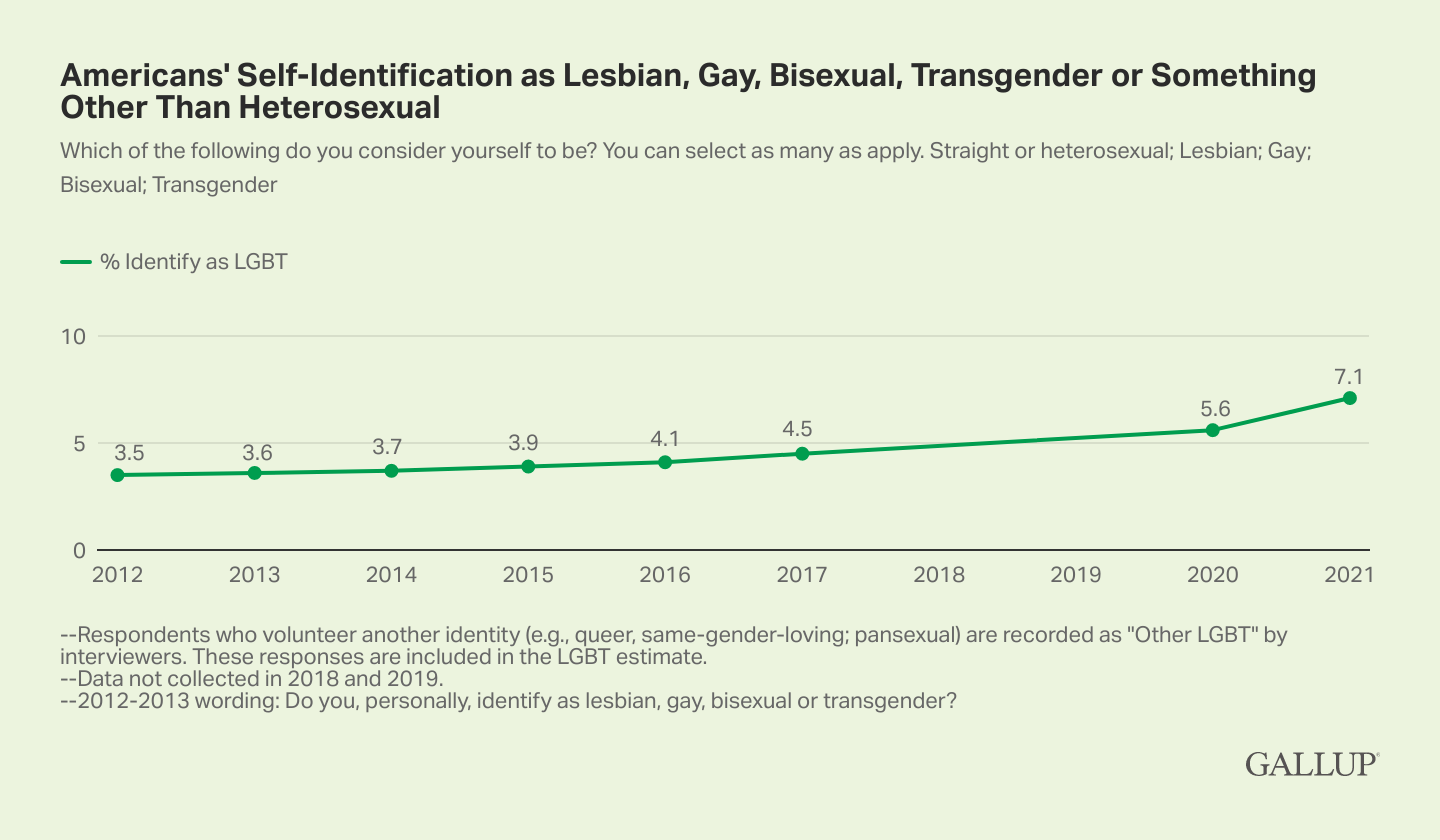
Line graph. Americans' Self-Identification as Lesbian, Gay, Bisexual, Transgender or Something Other than Heterosexual. Trend from 2012 to 2021 (question not asked in 2018 and 2019). Currently, 7.1% of U.S. adults identify as LGBT, up from 5.6% in 2020, 4.5% in 2017 and 4.1% in 2016. Between 2012 and 2015, the range was 3.5% to 3.9%.
The increase in LGBT identification in recent years largely reflects the higher prevalence of such identities among the youngest U.S. adults compared with the older generations they are replacing in the U.S. adult population.
Roughly 21% of Generation Z Americans who have reached adulthood -- those born between 1997 and 2003 -- identify as LGBT. That is nearly double the proportion of millennials who do so, while the gap widens even further when compared with older generations.
| LGBT | Straight/Heterosexual | No response | |
|---|---|---|---|
| % | % | % | |
| Generation Z (born 1997-2003) | 20.8 | 75.7 | 3.5 |
| Millennials (born 1981-1996) | 10.5 | 82.5 | 7.1 |
| Generation X (born 1965-1980) | 4.2 | 89.3 | 6.5 |
| Baby boomers (born 1946-1964) | 2.6 | 90.7 | 6.8 |
| Traditionalists (born before 1946) | 0.8 | 92.2 | 7.1 |
| Gallup, 2021 | |||
Gen Z adults made up 7% of Gallup's 2017 national sample, but in 2021 accounted for 12% as more from that generation reached age 18 over the past four years. In contrast, the proportion of those born before 1946 has fallen from 11% in 2017 to 8%.
LGBT Identification Has Been Stable in Older Generations, Rising in Younger
Since Gallup began measuring LGBT identification in 2012, the percentage of traditionalists, baby boomers, and Generation X adults who identify as LGBT has held relatively steady. At the same time, there has been a modest uptick among millennials, from 5.8% in 2012 (when some members of the generation had not yet turned 18) to 7.8% in 2017 and 10.5% currently.
The percentage of Gen Z who are LGBT has nearly doubled since 2017, when only the leading edge of that generation -- those born between 1997 and 1999 -- had reached adulthood. At that time, 10.5% of the small slice of the generation who were adults identified as LGBT.
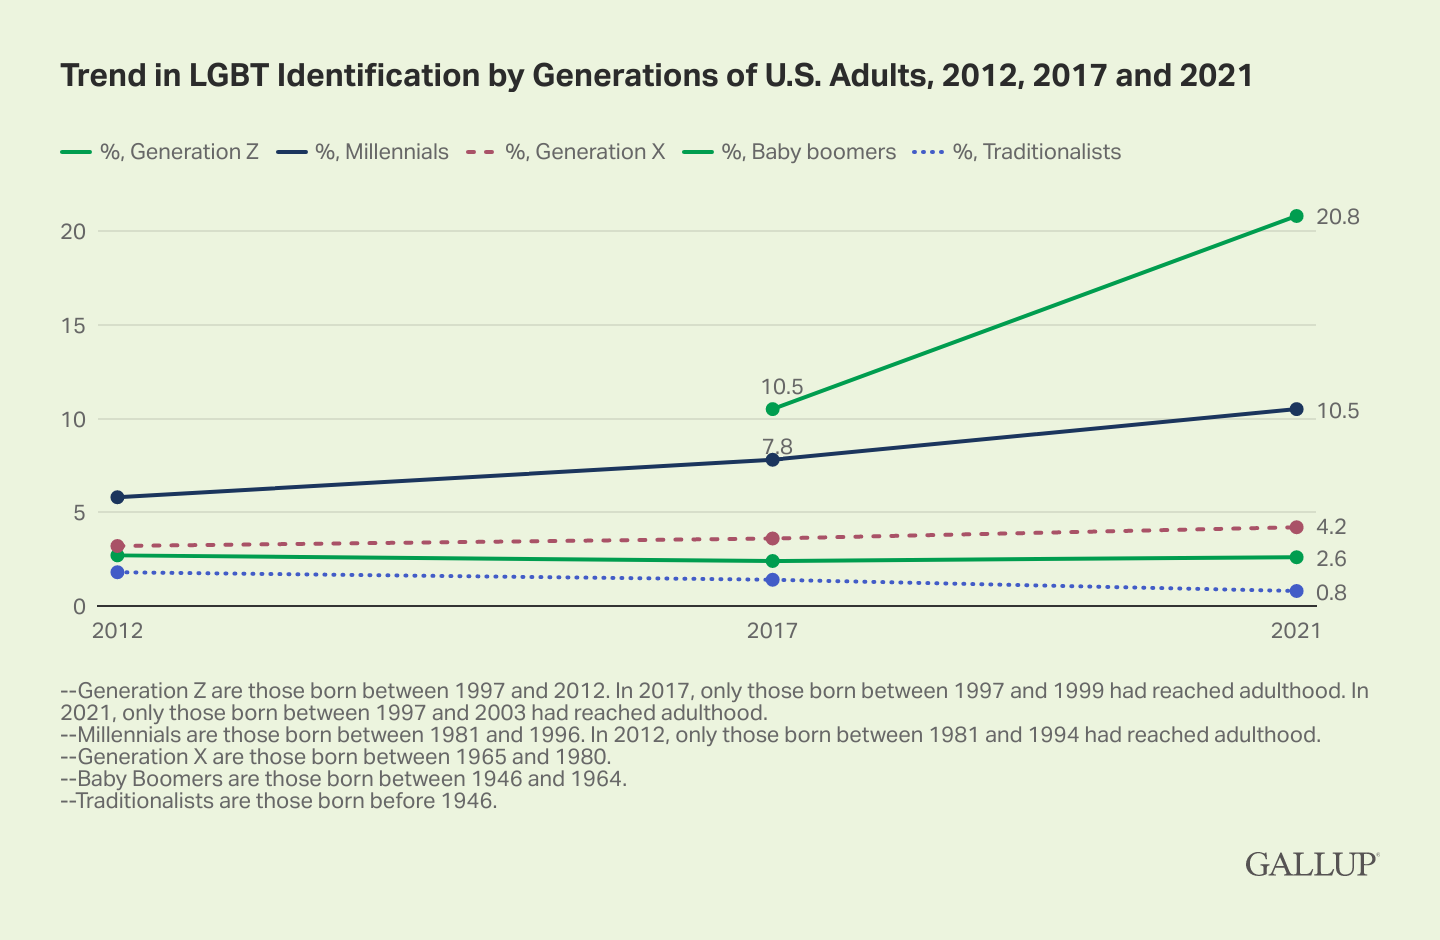
Line graph. Americans' Self-Identification as Lesbian, Gay, Bisexual, Transgender or Something Other than Heterosexual, by Generation. Trend in 2012, 2017 and 2021. LGBT identification has generally been stable among Generation X, baby boomers and traditionalists since 2012. The proportion of millennials identifying as LGBT has increased since 2012, while there has been a sharp increase among Generation Z since 2017.
Now a much greater proportion of Gen Z, but still not all of it, has become adults. The sharp increase in LGBT identification among this generation since 2017 indicates that the younger Gen Z members (those who have turned 18 since 2017) are more likely than the older members of the generation to identify as LGBT.
Should that trend within Gen Z continue, the proportion of U.S. adults in that generation who say they are LGBT will grow even higher once all members of the generation reach adulthood.
Bisexual Identification Most Common Among LGBT Americans
More than half of LGBT Americans, 57%, indicate they are bisexual. That percentage translates to 4.0% of all U.S. adults. Meanwhile, 21% of LGBT Americans say they are gay, 14% lesbian, 10% transgender and 4% something else. Each of these accounts for less than 2% of U.S. adults.
| Among LGBT U.S. adults | Among all U.S. adults | |
|---|---|---|
| % | % | |
| Lesbian | 13.9 | 1.0 |
| Gay | 20.7 | 1.5 |
| Bisexual | 56.8 | 4.0 |
| Transgender | 10.0 | 0.7 |
| Other (e.g., queer, same-gender-loving) | 4.3 | 0.3 |
| Percentages total more than 100% because respondents may choose more than one category. | ||
| Gallup, 2021 | ||
Gallup's pre-2020 polling did not measure how many Americans identified with each LGBT category, separately. However, earlier data collected from other research institutions as well as Gallup's 2020 estimate have consistently found bisexual to be the most common LGBT identity.
Prior Gallup analyses show bisexuals are much more likely to marry spouses or live with partners of a different sex than with spouses or partners who are the same sex as they are.
Nearly One in Six Generation Z Adults Identify as Bisexual
Bisexual is the most common LGBT status among Gen Z, millennials, and Gen X, while older Americans are about as likely to say they are gay or lesbian as to say they are bisexual.
Overall, 15% of Gen Z adults say they are bisexual, as do 6% of millennials and slightly less than 2% of Gen X.
Women (6.0%) are much more likely than men (2.0%) to say they are bisexual. Men are more likely to identify as gay (2.5%) than as bisexual, while women are much more likely to identify as bisexual than as lesbian (1.9%).
| Bisexual | Gay | Lesbian | Transgender | Other | |
|---|---|---|---|---|---|
| % | % | % | % | % | |
| Generation | |||||
| Generation Z | 15.0 | 2.5 | 2.0 | 2.1 | 1.2 |
| Millennials | 6.0 | 2.2 | 1.3 | 1.0 | 0.4 |
| Generation X | 1.7 | 1.1 | 0.8 | 0.6 | <0.05 |
| Baby boomers | 0.7 | 1.0 | 0.7 | 0.1 | 0.1 |
| Traditionalists | 0.2 | 0.4 | 0.1 | 0.2 | 0.1 |
| Gender | |||||
| Women | 6.0 | 0.4 | 1.9 | 0.8 | 0.4 |
| Men | 2.0 | 2.5 | 0.1 | 0.6 | 0.2 |
| --Figures represent the percentage of all adult members of each demographic group who have that sexual orientation or gender identity. --Some respondents identify with multiple sexual orientations or gender identities. --Generation definitions are as follows: Generation Z, born 1997 to 2003; millennials, born 1981 to 1996; Generation X, born 1965 to 1980; baby boomers, born 1946 to 1964; traditionalists, born before 1946. |
|||||
| Gallup, 2021 | |||||
Bottom Line
The proportion of U.S. adults who consider themselves to be lesbian, gay, bisexual or transgender has grown at a faster pace over the past year than in prior years. This is occurring as more of Gen Z is reaching adulthood. These young adults are coming of age, including coming to terms with their sexuality or gender identity, at a time when Americans increasingly accept gays, lesbians and transgender people, and LGBT individuals enjoy increasing legal protection against discrimination.
Given the large disparities in LGBT identification between younger and older generations of Americans, the proportion of all Americans who identify as LGBT can be expected to grow in the future as younger generations will constitute a larger share of the total U.S. adult population. With one in 10 millennials and one in five Gen Z members identifying as LGBT, the proportion of LGBT Americans should exceed 10% in the near future.
To stay up to date with the latest Gallup News insights and updates, follow us on Twitter.
Learn more about how the Gallup Poll Social Series works.