GALLUP NEWS SERVICE
PRINCETON, NJ -- With the theme "Speaking Truth to Power," the National Association for the Advancement of Colored People (NAACP) plans to use its upcoming annual convention, being held in New Orleans July 7-13, to address the challenges it sees facing "communities of color" nationwide. Some of these challenges are evident in a recent Gallup poll focusing on minority rights and relations.
The nationwide survey, conducted June 11-18, included larger-than-normal samples of blacks and Hispanics in order to study the views of these groups more closely than is ordinarily possible in a nationwide survey. On Tuesday, July 10 in Washington, D.C., The Gallup Organization will be releasing an expanded analysis of the state of race relations in the United States today as perceived by the people, including a new update of the Social Audit of Race Relations Between Black and White Americans. Details will be posted on gallup.com on Wednesday, July 11.
A review of the June 11-18 survey's results underscores first and foremost that a significant perceptual gap continues between the way whites view the situation for blacks in American society today and the way blacks themselves view it.
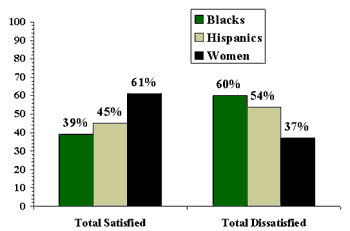
Six of 10 blacks are dissatisfied with the way people of their own race are treated by society, including 32% who are very dissatisfied and another 28% who are somewhat dissatisfied. Only 39% of blacks nationwide are satisfied, including just 8% who are very satisfied.
Contrast this with the views of white Americans. Almost two-thirds of whites -- 64% -- say they are personally satisfied with the way blacks are treated in society, while only 34% are dissatisfied.
Blacks' appraisal of their current situation in U.S. society is just slightly more negative than Hispanics' assessment of their own treatment: 45% of Hispanics are satisfied with the way Hispanics are treated in society and 54% are dissatisfied.
There is, on the other hand, no difference between whites' perceptions of Hispanics' situation in society and whites' perceptions of blacks' situation. Sixty-four percent of whites say they are satisfied with the way Hispanics are treated -- the exact percentage of whites who say they are satisfied with the way blacks are treated.
In short, the majority of whites apparently feel that the treatment of blacks and Hispanics in American society today is acceptable, while the majority of both of these latter two groups disagree.
| Society's Treatment of Own Group |
 |
| June 11-18, 2001 |
Blacks' Satisfaction With Life Lags Behind That of Whites
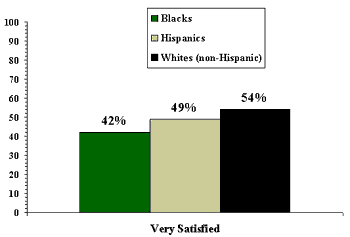
The overall assessment from blacks about their personal lives is generally positive. Close to nine in 10 blacks say they are either very or somewhat satisfied with their lives, while only 12% are dissatisfied. Significantly, however, only 42% of blacks feel "very" satisfied, compared to 49% of Hispanics and 54% of non-Hispanic whites who are very satisfied with their personal lives.
| Percentage "Very Satisfied" With Personal
Life |
 |
| June 11-18, 2001 |
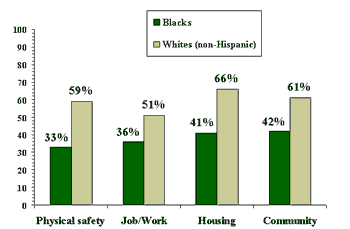
A follow-up question in the survey asked respondents about their satisfaction with several specific aspects of their lives. The results provide a road map for identifying the nature of the unique challenges facing black Americans today. The areas in which blacks tend to be least satisfied, and are far less satisfied than the white majority, include personal safety, one's job (for those employed), housing and the community in which they live.
Among these, safety from physical harm or violence stands out as the most troublesome experience peculiar to the black community. Only a third of blacks are very satisfied with their lives in this area, compared to 59% of non-Hispanic whites, yielding a 26-point racial gap -- the largest of all dimensions measured.
| Divergent Experiences Percentage "Very Satisfied" With Each Dimension |
 |
| June 11-18, 2001 |
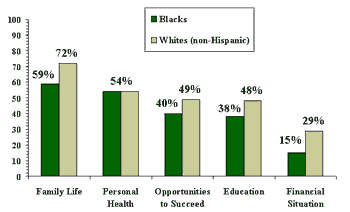
Areas in which blacks tend to be most satisfied or in which blacks and whites tend to be similar in their experiences include family life, personal health, perceived opportunities to succeed in life, education and personal finances.
| Similar Experiences Percentage "Very Satisfied" With Each Dimension |
 |
| June 11-18, 2001 |
Survey Methods
These results are based on telephone interviews with a randomly selected national sample of 1,375 adults, 18 years and older, including a main sample of 1,004 national adults and oversamples of blacks and Hispanics. Telephone interviews were conducted from June 11-17, 2001. An additional night of interviewing on June 18 was conducted for the black oversample. For results based on the total sample of 1,004 national adults, one can say with 95 percent confidence that the maximum error attributable to sampling and other random effects is plus or minus 3 percentage points. Results based on the subsample of blacks include interviews with 264 black national adults and have a margin of sampling error of plus or minus 7 percentage points. Results based on the subsample of Hispanics include interviews with 247 Hispanic national adults (including 59 conducted in Spanish) and have a margin of sampling error of plus or minus 7 percentage points. In addition to sampling error, question wording and practical difficulties in conducting surveys can introduce error or bias into the findings of public opinion polls.
Overall, how satisfied are you with your life -- are you very satisfied, somewhat satisfied, somewhat dissatisfied, or very dissatisfied?
|
Very |
Somewhat satisfied |
Somewhat dissatisfied |
Very |
No |
|
|
% |
% |
% |
% |
% |
|
|
2001 Jun 11-17 |
|||||
|
National Adults |
53 |
38 |
6 |
2 |
1 |
|
Men |
55 |
36 |
6 |
2 |
1 |
|
Women |
50 |
40 |
7 |
3 |
* |
|
Non-Hispanic Whites |
54 |
38 |
5 |
3 |
* |
|
Blacks |
42 |
45 |
11 |
1 |
1 |
|
Hispanics |
49 |
39 |
9 |
3 |
* |
|
* Less than 0.5% |
|||||
Next we'd like to know how satisfied are you with each of the following aspects of your life -- very satisfied, somewhat satisfied, somewhat dissatisfied, or very dissatisfied. How satisfied are you with -- [RANDOM ORDER]?
A. Your community as a place to live in
|
Very |
Somewhat satisfied |
Somewhat dissatisfied |
Very |
No |
|
|
% |
% |
% |
% |
% |
|
|
2001 Jun 11-17 |
|||||
|
National Adults |
58 |
30 |
8 |
4 |
* |
|
Men |
59 |
29 |
8 |
3 |
1 |
|
Women |
57 |
30 |
8 |
5 |
* |
|
Non-Hispanic Whites |
61 |
29 |
6 |
4 |
* |
|
Blacks |
42 |
38 |
11 |
8 |
1 |
|
Hispanics |
53 |
31 |
12 |
4 |
* |
B. Your current housing
|
Very |
Somewhat satisfied |
Somewhat dissatisfied |
Very |
No |
|
|
% |
% |
% |
% |
% |
|
|
2001 Jun 11-17 |
|||||
|
National Adults |
63 |
30 |
5 |
2 |
* |
|
Men |
63 |
32 |
4 |
* |
1 |
|
Women |
63 |
27 |
7 |
3 |
* |
|
Non-Hispanic Whites |
66 |
27 |
5 |
2 |
* |
|
Blacks |
41 |
43 |
11 |
5 |
* |
|
Hispanics |
45 |
36 |
11 |
8 |
* |
C. Your education
|
Very |
Somewhat satisfied |
Somewhat dissatisfied |
Very |
No |
|
|
% |
% |
% |
% |
% |
|
|
2001 Jun 11-17 |
|||||
|
National Adults |
45 |
42 |
9 |
3 |
1 |
|
Men |
48 |
40 |
9 |
2 |
1 |
|
Women |
44 |
43 |
9 |
3 |
1 |
|
Non-Hispanic Whites |
48 |
40 |
8 |
3 |
1 |
|
Blacks |
38 |
44 |
15 |
3 |
0 |
|
Hispanics |
38 |
41 |
13 |
7 |
1 |
D. Your family life
|
Very |
Somewhat satisfied |
Somewhat dissatisfied |
Very |
No |
|
|
% |
% |
% |
% |
% |
|
|
2001 Jun 11-17 |
|||||
|
National Adults |
69 |
25 |
3 |
2 |
1 |
|
Men |
72 |
25 |
1 |
1 |
1 |
|
Women |
67 |
25 |
4 |
3 |
1 |
|
Non-Hispanic Whites |
72 |
22 |
3 |
2 |
1 |
|
Blacks |
59 |
32 |
5 |
3 |
1 |
|
Hispanics |
73 |
21 |
4 |
2 |
0 |
E. Your financial situation
|
Very |
Somewhat satisfied |
Somewhat dissatisfied |
Very |
No |
|
|
% |
% |
% |
% |
% |
|
|
2001 Jun 11-17 |
|||||
|
National Adults |
26 |
51 |
15 |
7 |
1 |
|
Men |
28 |
52 |
15 |
5 |
* |
|
Women |
25 |
51 |
14 |
10 |
* |
|
Whites |
29 |
50 |
14 |
7 |
* |
|
Blacks |
15 |
47 |
20 |
17 |
1 |
|
Hispanics |
23 |
47 |
17 |
13 |
* |
F. Your personal health
|
Very |
Somewhat satisfied |
Somewhat dissatisfied |
Very |
No |
|
|
% |
% |
% |
% |
% |
|
|
2001 Jun 11-17 |
|||||
|
National Adults |
54 |
35 |
6 |
5 |
* |
|
Men |
57 |
34 |
6 |
3 |
0 |
|
Women |
52 |
35 |
7 |
6 |
* |
|
Non-Hispanic Whites |
54 |
34 |
7 |
5 |
* |
|
Blacks |
54 |
35 |
7 |
3 |
1 |
|
Hispanics |
57 |
30 |
8 |
5 |
0 |
G. Your safety from physical harm or violence
|
Very |
Somewhat satisfied |
Somewhat dissatisfied |
Very |
No |
|
|
% |
% |
% |
% |
% |
|
|
2001 Jun 11-17 |
|||||
|
National Adults |
55 |
33 |
7 |
4 |
1 |
|
Men |
61 |
31 |
5 |
2 |
1 |
|
Women |
50 |
35 |
9 |
6 |
* |
|
Non-Hispanic Whites |
59 |
31 |
7 |
3 |
* |
|
Blacks |
33 |
45 |
10 |
11 |
1 |
|
Hispanics |
47 |
32 |
12 |
8 |
1 |
H. The opportunities you have had to succeed in life
|
Very |
Somewhat satisfied |
Somewhat dissatisfied |
Very |
No |
|
|
% |
% |
% |
% |
% |
|
|
2001 Jun 11-17 |
|||||
|
National Adults |
48 |
38 |
10 |
3 |
1 |
|
Men |
53 |
36 |
8 |
2 |
1 |
|
Women |
43 |
40 |
11 |
4 |
2 |
|
Non-Hispanic Whites |
49 |
37 |
10 |
3 |
1 |
|
Blacks |
40 |
43 |
10 |
6 |
1 |
|
Hispanics |
44 |
36 |
10 |
8 |
2 |
I. Your job, or the work you do
|
Very |
Somewhat satisfied |
Somewhat dissatisfied |
Very |
No |
||
|
% |
% |
% |
% |
% |
||
|
2001 Jun 11-17^ |
||||||
|
National Adults |
50 |
39 |
7 |
4 |
0 |
|
|
Men |
50 |
39 |
6 |
5 |
0 |
|
|
Women |
50 |
38 |
8 |
4 |
0 |
|
|
Non-Hispanic Whites |
51 |
37 |
7 |
5 |
0 |
|
|
Blacks |
36 |
47 |
9 |
7 |
1 |
|
|
Hispanics |
51 |
35 |
7 |
7 |
0 |
|
|
^ |
BASED ON FULL- OR PART-TIME EMPLOYED NATIONAL ADULTS: N=646; ±4 PCT. PTS. |
|||||
|
BASED ON FULL- OR PART-TIME EMPLOYED NATIONAL ADULT MEN: N=343; ±6 PCT. PTS. |
||||||
|
BASED ON FULL- OR PART-TIME EMPLOYED NATIONAL ADULT WOMEN: N=303; ±6 PCT. PTS. |
||||||
|
BASED ON FULL- OR PART-TIME EMPLOYED WHITES: N=528; ±5 PCT. PTS. |
||||||
|
BASED ON FULL- OR PART-TIME EMPLOYED BLACKS: N=169; ±9 PCT. PTS. |
||||||
|
BASED ON FULL- OR PART-TIME EMPLOYED HISPANICS: N=153; ±9 PCT. PTS. |
||||||
|
* |
Less than 0.5% |
|||||
SATISFACTION SUMMARY TABLE (BASED ON "VERY SATISFIED")
|
2001 Jun 11-17 |
National Adults |
(NA) |
(NA) |
Non-Hisp. |
|
|
|
% |
% |
% |
% |
% |
% |
|
|
Family life |
69 |
72 |
67 |
72 |
59 |
73 |
|
Current housing |
63 |
63 |
63 |
66 |
41 |
45 |
|
Community as a place to live in |
58 |
59 |
57 |
61 |
42 |
53 |
|
Safety from physical harm/violence |
55 |
61 |
50 |
59 |
33 |
47 |
|
Personal health |
54 |
57 |
52 |
54 |
54 |
57 |
|
Job/work |
50 |
50 |
50 |
51 |
36 |
51 |
|
Opportunities to succeed in life |
48 |
53 |
43 |
49 |
40 |
44 |
|
Education |
45 |
48 |
44 |
48 |
38 |
38 |
|
Financial situation |
26 |
28 |
25 |
29 |
15 |
23 |
|
(NA) National Adults |
||||||
Next we'd like to know how you feel about the way various groups in society are treated. For each of the following groups please say whether you are very satisfied, somewhat satisfied, somewhat dissatisfied, or very dissatisfied with the way they are treated. How about -- [RANDOM ORDER]?
A. Immigrants
|
Very |
Somewhat satisfied |
Somewhat dissatisfied |
Very |
No |
|
|
% |
% |
% |
% |
% |
|
|
2001 Jun 11-17 |
|||||
|
National Adults |
14 |
40 |
27 |
14 |
5 |
|
Men |
17 |
43 |
25 |
11 |
4 |
|
Women |
12 |
36 |
29 |
17 |
6 |
|
Non-Hispanic Whites |
15 |
43 |
28 |
9 |
5 |
|
Blacks |
6 |
29 |
32 |
25 |
8 |
|
Hispanics |
10 |
26 |
27 |
33 |
4 |
B. Women
|
Very |
Somewhat satisfied |
Somewhat dissatisfied |
Very |
No |
|
|
% |
% |
% |
% |
% |
|
|
2001 Jun 11-17 |
|||||
|
National Adults |
24 |
46 |
18 |
11 |
1 |
|
Men |
35 |
45 |
13 |
6 |
1 |
|
Women |
13 |
48 |
22 |
15 |
2 |
|
Non-Hispanic Whites |
24 |
49 |
17 |
9 |
1 |
|
Blacks |
14 |
33 |
31 |
20 |
2 |
|
Hispanics |
27 |
33 |
18 |
20 |
2 |
C. Blacks
|
Very |
Somewhat satisfied |
Somewhat dissatisfied |
Very |
No |
|
|
% |
% |
% |
% |
% |
|
|
2001 Jun 11-17 |
|||||
|
National Adults |
20 |
41 |
24 |
13 |
2 |
|
Men |
26 |
40 |
21 |
11 |
2 |
|
Women |
15 |
43 |
26 |
14 |
2 |
|
Non-Hispanic Whites |
20 |
44 |
25 |
9 |
2 |
|
Blacks |
8 |
31 |
28 |
32 |
1 |
|
Hispanics |
15 |
35 |
26 |
18 |
6 |
D. Hispanics
|
Very |
Somewhat satisfied |
Somewhat dissatisfied |
Very |
No |
|
|
% |
% |
% |
% |
% |
|
|
2001 Jun 11-17 |
|||||
|
National Adults |
16 |
44 |
23 |
12 |
5 |
|
Men |
19 |
48 |
20 |
10 |
3 |
|
Women |
13 |
41 |
27 |
13 |
6 |
|
Non-Hispanic Whites |
17 |
47 |
23 |
9 |
4 |
|
Blacks |
7 |
34 |
31 |
20 |
8 |
|
Hispanics |
15 |
30 |
25 |
29 |
1 |
E. Asians
|
Very |
Somewhat satisfied |
Somewhat dissatisfied |
Very |
No |
|
|
% |
% |
% |
% |
% |
|
|
2001 Jun 11-17 |
|||||
|
National Adults |
21 |
48 |
18 |
5 |
8 |
|
Men |
26 |
48 |
15 |
6 |
5 |
|
Women |
16 |
48 |
21 |
5 |
10 |
|
Non-Hispanic Whites |
21 |
50 |
18 |
4 |
7 |
|
Blacks |
13 |
40 |
26 |
12 |
9 |
|
Hispanics |
18 |
33 |
22 |
13 |
14 |
SATISFACTION SUMMARY TABLE (BASED ON "VERY/SOMEWHAT SATISFIED")
|
|
|
|
|
Non-Hispanic Whites |
|
|
|
% |
% |
% |
% |
% |
% |
|
|
Women |
70 |
80 |
61 |
73 |
47 |
60 |
|
Asians |
69 |
74 |
64 |
71 |
53 |
51 |
|
Blacks |
61 |
66 |
58 |
64 |
39 |
50 |
|
Hispanics |
60 |
67 |
54 |
64 |
41 |
45 |
|
Immigrants |
54 |
60 |
48 |
58 |
35 |
36 |
|
(NA) National Adults |
||||||
