GALLUP NEWS SERVICE
PRINCETON, NJ – The death penalty remains one of the more controversial issues in American politics, and continues to find its way into the news this year. Recently, Maryland Governor Paris Glendening promised to stay any executions there until the state completes a study examining racial discrimination in death sentences in that state. The state of Illinois has had a moratorium in place since 2000 and is now considering an overhaul of its death penalty system. Next month the U.S. Supreme Court is expected to announce its decision about the constitutionality of executing mentally retarded defendants.
A recent Gallup poll shows Americans tend to believe the death penalty is applied fairly in this country, though a substantial number believes it is not. Nearly half of Americans say the death penalty is not imposed often enough. Support for the death penalty in general is slightly higher this year than in previous years. Very few Americans, though, say they support the death penalty for the mentally retarded, the mentally ill, or juveniles.
The poll, conducted May 6-9, finds that just over half of Americans, 53%, believe the death penalty is applied fairly in this country, while 40% say it is applied unfairly. Opinion on this matter has changed very little since it was last asked in June 2000, at which time 51% said it was applied fairly and 41% said unfairly.
The new Gallup data reveal many differences by subgroup in regard to the fairness of the death penalty. While 58% of whites believe it is applied fairly, the majority of non-whites, 54%, believe it is not. Similarly, 63% of conservatives say the death penalty is applied fairly while 56% of liberals say it is applied unfairly. A majority of those with post-graduate educations say the death penalty is applied unfairly, but a majority of every other educational group believes it is used in a fair manner. And while a majority of each age group believes the death penalty is applied fairly, those between the ages of 18 and 29 are much more likely to express this view.
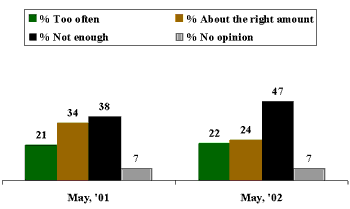
When asked about the frequency with which the death penalty is imposed, nearly half of Americans say the death penalty is not imposed often enough, with roughly equal percentages saying it is imposed too often (22%) and the right amount of time (24%). The percentage saying the death penalty is not imposed often enough has increased from 38% last year to 47%, while the percent saying it is imposed the right amount of time has dropped from 34% to 24%.
| Opinion of How Often Death Penalty Imposed |
 |
Seven in 10 Americans Favor Death Penalty
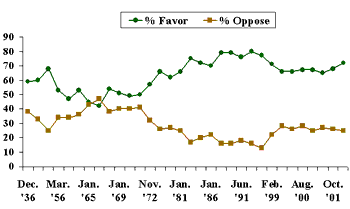
More generally, the poll shows that 72% of Americans favor the death penalty for persons convicted of murder, while 25% are opposed. The level of support is up slightly from last year, when 68% were in favor, and higher than it has been in recent years. The highest level of support using this measure (which dates back to 1936) was 80% in 1994.
| Death Penalty For Convicted Murderers? |
 |
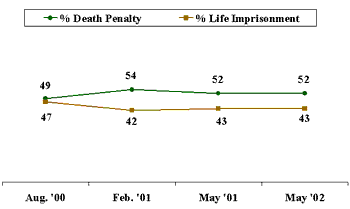
About two-thirds of Americans say the death penalty is "morally acceptable", while 28% say it is not. When given a choice of the death penalty or life imprisonment as the better penalty for murder, a slim majority prefers the death penalty, consistent with recent data on this question. The current numbers show 52% favoring the death penalty and 43% favoring life imprisonment.
| Death Penalty Or Life Imprisonment For Convicted Murderers? |
 |
Few Support Death Penalty for Mentally Retarded, Mentally Ill and Children
Soon, the Supreme Court will announce its decision in a Virginia case that questions the constitutionality of the death penalty for the mentally retarded. The vast majority of Americans, 82%, say they oppose the use of the death penalty for the mentally retarded, while just 13% support it. Similarly low levels of support are evident as far as applying the death penalty to the mentally ill (19% favor and 75% oppose). This was an issue in the recent case of Andrea Yates, who was sentenced to life in prison rather than death upon being found guilty in the deaths of her five children.
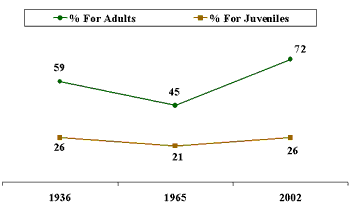
Only about one in four Americans favors the death penalty for juveniles, while 69% are opposed. Historically, Americans have been far less supportive of the death penalty for those under 21 than for adults, but the gap in support may be widening, as support for the death penalty overall increases but support for allowing it for children has been fairly constant. In 1936, at a time when 59% of Americans favored the death penalty, just 26% favored it for persons under age 21. In 1965, just 21% favored the death penalty for persons under age 21, at a time when 45% favored the death penalty in general.
| Comparison: Death Penalty For Adults and Juveniles |
 |
The public does not make an exception for women; however, as support for using the death penalty for women at 68% is only slightly lower than it is overall (72%). Over time, it appears as though Americans have become somewhat more supportive of applying the death penalty to women. Gallup last addressed the issue in 1937, and found 60% of Americans favored the death penalty overall and 51% favored it for women.
| Death Penalty For Women, Juveniles, Mentally Ill? |
 |
| May 6-9, 2002 |
Survey Methods
These results are based on telephone interviews with a randomly selected national sample of 1,012 adults, 18 years and older, conducted May 6-9, 2002. For results based on this sample, one can say with 95 percent confidence that the maximum error attributable to sampling and other random effects is plus or minus 3 percentage points. In addition to sampling error, question wording and practical difficulties in conducting surveys can introduce error or bias into the findings of public opinion polls.
Are you in favor of the death penalty for a person convicted of murder?
BASED ON --475-- NATIONAL ADULTS
|
|
|
No |
|
|
No |
|||
|
% |
% |
% |
% |
% |
% |
|||
|
2002 May 6-9 ^ |
72 |
25 |
3 |
1981 Jan 30-Feb 2 |
66 |
25 |
9 |
|
|
1978 Mar 3-6 |
62 |
27 |
11 |
|||||
|
2001 Oct 11-14 |
68 |
26 |
6 |
1976 Apr 9-12 |
66 |
26 |
8 |
|
|
2001 May 10-14 ^ |
65 |
27 |
8 |
1972 Nov 10-13 |
57 |
32 |
11 |
|
|
2001 Feb 19-21 ^ |
67 |
25 |
8 |
1972 Mar 3-5 |
50 |
41 |
9 |
|
|
2000 Aug 29-Sep 5 |
67 |
28 |
5 |
1971 Oct 29-Nov 2 |
49 |
40 |
11 |
|
|
2000 Jun 23-25 |
66 |
26 |
8 |
1969 Jan 23-28 |
51 |
40 |
9 |
|
|
2000 Feb 14-15 |
66 |
28 |
6 |
1967 Jun 2-7 |
54 |
38 |
8 |
|
|
1999 Feb 8-9 |
71 |
22 |
7 |
1966 May 19-24 |
42 |
47 |
11 |
|
|
1995 May 11-14 |
77 |
13 |
10 |
1965 Jan 7-12 |
45 |
43 |
12 |
|
|
1994 Sep 6-7 |
80 |
16 |
4 |
1960 Mar 2-7 |
53 |
36 |
11 |
|
|
1991 Jun 13-16 |
76 |
18 |
6 |
1957 Aug 29-Sep 4 |
47 |
34 |
18 |
|
|
1988 Sep 25-Oct 1 |
79 |
16 |
5 |
1956 Mar 29-Apr 3 |
53 |
34 |
13 |
|
|
1988 Sep 9-11 |
79 |
16 |
5 |
1953 Nov 1-5 |
68 |
25 |
7 |
|
|
1986 Jan 10-13 |
70 |
22 |
8 |
1937 Dec 1-6 |
60 |
33 |
7 |
|
|
1985 Jan 11-14 |
72 |
20 |
8 |
1936 Dec 2-7 |
59 |
38 |
3 |
|
|
1985 Nov 11-18 |
75 |
17 |
8 |
|||||
|
^ Asked of half sample. |
||||||||
If you could choose between the following two approaches, which do you think is the better penalty for murder -- [ROTATED: the death penalty (or) life imprisonment, with absolutely no possibility of parole]?
BASED ON --537-- NATIONAL ADULTS
|
The death penalty |
Life imprisonment |
No opinion |
|
|
% |
% |
% |
|
|
2002 May 6-9 |
52 |
43 |
5 |
|
2001 May 10-14 |
52 |
43 |
5 |
|
2001 Feb 19-21 |
54 |
42 |
4 |
|
2000 Aug 29-Sep 5 |
49 |
47 |
4 |
In your opinion, is the death penalty imposed -- [ROTATED: too often, about the right amount, or not often enough]?
|
Too |
About the |
Not |
No |
|
|
% |
% |
% |
% |
|
|
2002 May 6-9 |
22 |
24 |
47 |
7 |
|
2001 May 10-14 |
21 |
34 |
38 |
7 |
Do you favor or oppose the death penalty for -- [RANDOM ORDER]? How about for -- [INSERT NEXT ITEM]?
A. Women
|
Favor |
Oppose |
No opinion |
|
|
% |
% |
% |
|
|
2002 May 6-9 |
68 |
29 |
3 |
B. The mentally ill
|
Favor |
Oppose |
No opinion |
|
|
% |
% |
% |
|
|
2002 May 6-9 |
19 |
75 |
6 |
C. The Mentally retarded
|
Favor |
Oppose |
No opinion |
|
|
% |
% |
% |
|
|
2002 May 6-9 |
13 |
82 |
5 |
D. Juveniles
|
Favor |
Oppose |
No opinion |
|
|
% |
% |
% |
|
|
2002 May 6-9 |
26 |
69 |
5 |
Generally speaking, do you believe the death penalty is applied fairly or unfairly in this country today?
|
Fairly |
Unfairly |
No opinion |
|
|
% |
% |
% |
|
|
2002 May 6-9 |
53 |
40 |
7 |
|
2000 Jun 23-25 |
51 |
41 |
8 |
