GALLUP NEWS SERVICE
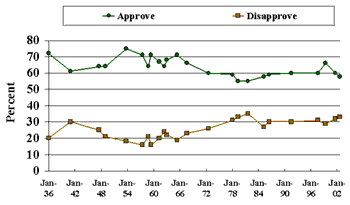
PRINCETON, NJ -- For over six and a half decades, Gallup polls have found Americans expressing widespread support for labor unions. Gallup's initial reading in 1936 showed 72% of Americans approving and just 20% disapproving of unions. During World War II, support declined somewhat but rebounded in the postwar years. In the late 1960s, public approval of unions began to wane and reached its low point in the late 1970s and early 1980s, during a period of immense economic uncertainty. Even then, the worst margin of approval was 55% to 35%. In the most recent poll, the comparable figures are 58% to 35%. Over the past 30 years, the margin of public approval has averaged about 60% to 30%.
| Approve or Disapprove of Labor
Unions? 1936-2002 |
 |
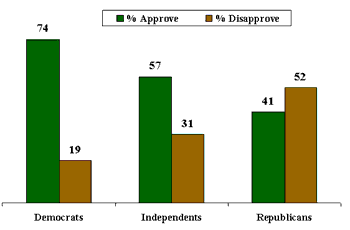
Despite the economic focus of unions, public approval is related more strongly to people's political orientations than to their economic status. The differences in support among Republicans, independents and Democrats are much greater than those among people in different income categories. As shown in the chart below, Democrats approve of unions by 74% to 19%, while Republicans disapprove by 52% to 41%. Independents are about halfway between the two, approving by 57% to 31%.
| Approve or Disapprove of Labor
Unions? Compared by Party |
 |
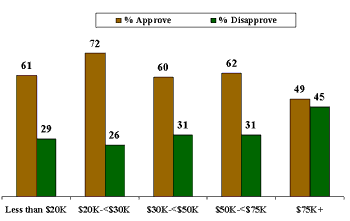
By contrast, there are only slight differences in support among people in five income groups. As shown in the following table, at all levels of income below $75,000 a year, people approve of unions by at least a two-to-one margin. Among those in the highest income category, there is still net approval, but the margin is slight, 49% to 45%. Still, the differences are clearly not as pronounced as those shown in the previous chart.
| Approve or Disapprove of Labor
Unions? Compared by Income |
 |
The poll shows that overall, about 14% of households in the country have a family member who belongs to a union. And, not surprisingly, approval in these households is much higher than in the rest of the country -- 78% vs. 54%, respectively.
Overall, the public seems relatively satisfied with the strength of labor unions. While 27% would like to see unions have more influence, 31% would like them to have less influence. Another 36% opt for no change.
Would you, personally, like to see labor unions in the United States have -- [ROTATED: more influence than they have today, the same amount as today, (or) less influence than they have today]?
|
More influence |
Same amount |
Less influence |
No opinion |
|
|
% |
% |
% |
% |
|
|
2002 Aug 5-8 |
27 |
36 |
31 |
6 |
|
2001 Aug 16-19 |
30 |
35 |
31 |
4 |
|
1999 Aug 24-26 |
30 |
36 |
32 |
2 |
More people think unions will decline in strength than increase, by 36% to 23%. Another 35% expect unions to remain about as strong as they are today. Over the past three years, there has been a slight decline in the number who expect unions to get weaker, and a slight increase in the number who expect unions to remain about as strong as they are today.
Thinking about the future, do you think labor unions in this country will become -- [ROTATED: stronger than they are today, the same as today, (or) weaker than they are today]?
|
Stronger |
Same |
Weaker |
No |
|
|
% |
% |
% |
% |
|
|
2002 Aug 5-8 |
23 |
35 |
36 |
6 |
|
2001 Aug 16-19 |
24 |
30 |
40 |
6 |
|
1999 Aug 24-26 |
25 |
28 |
44 |
3 |
Despite their support of labor unions, Americans show only a slight bias in favor of unions over employers. When asked if their sympathies over the past two or three years have been more on the side of unions or on the side of the companies, Americans choose unions by a slight margin of 44% to 36%. These results are similar to those found in Gallup polls in 1999 and 2001.
In the labor disputes of the last two or three years, have your sympathies, in general been -- [ROTATED: on the side of unions (or) on the side of the companies]?
|
|
|
NEITHER |
BOTH |
No |
|
|
% |
% |
% |
% |
% |
|
|
2002 Aug 5-8 |
44 |
36 |
5 |
5 |
10 |
|
2001 Aug 16-19 |
45 |
37 |
4 |
5 |
9 |
|
1999 Aug 24-26 |
45 |
37 |
5 |
6 |
7 |
In the current dispute between baseball players and owners, by contrast, a slight plurality of baseball fans say they favor the owners over the players, by 43% to 30%.
Survey Methods
The latest results are based on telephone interviews with 1,007 national adults, aged 18+, conducted Aug. 5-8, 2002. For results based on the total sample of national adults, one can say with 95% confidence that the margin of sampling error is ±3 percentage points. In addition to sampling error, question wording and practical difficulties in conducting surveys can introduce error or bias into the findings of public opinion polls.
Now thinking about something a little different,
Do you approve or disapprove of labor unions?
|
|
|
Dis-approve |
No |
|
|
% |
% |
% |
||
|
2002 Aug 5-8 |
58 |
33 |
9 |
|
|
2001 Aug 16-19 |
60 |
32 |
8 |
|
|
1999 Aug 24-26 |
65 |
28 |
7 |
|
|
1999 Mar 5-7 |
66 |
29 |
5 |
|
|
1997 Aug 12-13 |
60 |
31 |
9 |
|
|
1991 Jul 18-21 |
60 |
30 |
10 |
|
|
1986 Jul 11-14 |
59 |
30 |
11 |
|
|
1985 Apr 12-15 |
58 |
27 |
15 |
|
|
1981 Aug 14-17 |
55 |
35 |
11 |
|
|
1979 May 4-7 |
55 |
33 |
12 |
|
|
1978 Jan 6-9 |
59 |
31 |
10 |
|
|
1972 Dec 8-11 |
60 |
25 |
15 |
|
|
1972 Mar 24-27 |
60 |
27 |
13 |
|
|
1967 Sep 14-19 |
66 |
23 |
11 |
|
|
1965 May 13-18 |
71 |
19 |
11 |
|
|
1963 Jan 11-16 |
68 |
22 |
10 |
|
|
1962 Jun 28-Jul 3 |
64 |
24 |
11 |
|
|
1961 Sep 21-26 |
69 |
20 |
11 |
|
|
1961 May 4-9 |
63 |
23 |
14 |
|
|
1961 Jan 12-17 |
70 |
18 |
12 |
|
|
1959 Aug 20-25 |
73 |
14 |
12 |
|
|
1959 Jan 7-12 |
68 |
19 |
13 |
|
|
1958 Oct 15-20 |
64 |
21 |
15 |
|
|
1957 Aug 29-Sep 4 |
65 |
18 |
17 |
|
|
1957 Apr 6-11 |
74 |
17 |
9 |
|
|
1957 Jan 17-22 |
75 |
14 |
11 |
|
|
1953 Oct 9-14 |
75 |
18 |
7 |
|
|
1948 Dec 10-15 |
64 |
21 |
15 |
|
|
1947 Jul 4-9 |
64 |
25 |
11 |
|
|
1941 |
61 |
30 |
9 |
|
|
1936 |
72 |
20 |
8 |
Is anyone living in your household a member of a labor union?
|
Yes |
No |
No opinion |
|
|
2002 Aug 5-8 |
14% |
85 |
1 |
Are you a member of a labor union, or does some other member of your household belong to a labor union?
COMBINED RESPONSES (D18/D18a)
|
2002 Aug 5-8 |
||
|
% |
||
|
Yes, member of household in a labor union |
14 |
|
|
Respondent in labor union |
(6) |
|
|
Other member of household in labor union |
(7) |
|
|
Both respondent and other household member in labor union |
(1) |
|
|
Unsure |
(--) |
|
|
No, no member of household in a labor union |
85 |
|
|
No opinion |
1 |
|
