GALLUP NEWS SERVICE
PRINCETON, NJ -- Smokers inspired to quit by today's "Great American Smokeout" won't find continued encouragement tomorrow when the new James Bond movie, Die Another Day, opens. According to the Sunday Times of London, for the first time in 13 years, 007 will be lighting up -- with Cuban cigars. A more effective deterrent would be to frequent smoke-free zones, which a sizable number of cigarette smokers admit has caused them to smoke less.
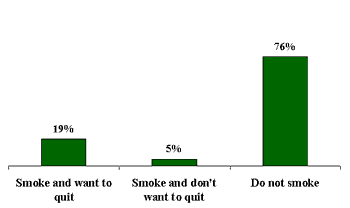
Gallup polling suggests that the target market for the American Cancer Society's (ACS) "Great American Smokeout" includes nearly one in five Americans. That's the number of people who currently smoke cigarettes and wish they could quit. Twenty-four percent of national adults told Gallup in a survey earlier this year that they smoke cigarettes, and most of them -- 79% -- say they would like to give it up.
| Smoker Types |
 |
| July 9-11, 2002 |
The Downward Trend in Smoking
In its Healthy People 2010 initiative, the office of the U.S. surgeon general has set a goal of reducing the rate of adult smoking in the United States to 12% by the year 2010 -- effectively cutting the rate of smoking in half. However, given the fact that the percentage of adults who smoke has changed little over the last decade, it would be a monumental achievement if the 12% goal were reached that quickly.
Looking farther back, historically, Americans are clearly smoking less today than in the past. According to Gallup's trends on cigarette use dating back to 1944, the high point for smoking was 1954 when 45% said that they had smoked cigarettes within the past seven days. The percentage of smokers held at about 40% for two more decades before dropping into the 30%-to-38% range during most of the 1980s. Since the 1990s, the rate of smoking has hovered around 25%.
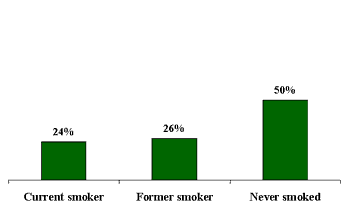
| National Adults Smoking History |
 |
| July 9-11, 2002 |
One encouraging sign for smokers looking to quit is the large number of their fellow Americans who say they used to smoke but have stopped. Enough people have quit smoking over the years that Gallup's latest smoking survey, conducted July 9-11, 2002, finds roughly one former smoker for every current smoker. Exactly half of American adults tell Gallup they have never smoked cigarettes.
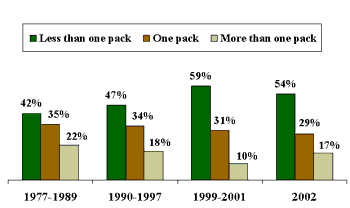
| Number of Cigarettes Smoked Per Day |
 |
No Smoking Zones Having an Impact
The ACS reports that one of the most effective means of getting people to cut back on their smoking or even quit, is to prohibit smoking in the workplace. Citing a study reported in a July issue of the British Medical Journal, the ACS says that smoke-free workplaces bring about a 29% reduction in cigarette use. They do so both by causing the prevalence of smokers to drop (by 4%) and reducing cigarette use among continued smokers (by three cigarettes per day).
Gallup data reinforce this conclusion. More than a quarter of current smokers say they are smoking less because of increased restrictions on smoking in public -- and that doesn't count the number of former smokers who previously quit because of the restrictions. Restrictions on smoking in the workplace seem to have a particularly strong impact, as 31% of employed smokers, compared with only 22% of non-employed smokers, say they smoke less because of smoking restrictions in public.
The percentage of smokers who smoke more than a pack of cigarettes per day is much lower today than in 1977 when Gallup first asked smokers about their amount of smoking. However, after a particularly sharp decline in heavy smoking a few years ago, the 2002 Gallup survey showed the number of heavy smokers increasing again (from an average of 10% of smokers in 1999-2000, up to 17% of smokers today). Still, a majority of smokers (54%) say they smoke less than a pack a day.
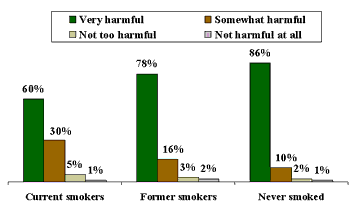
| Perceived Harm of Smoking, by Smoking Status |
 |
| July 9-11, 2002 |
Smoking's Harm Perceived Differently
Part of the reason some smokers may still not have quit is that they lack sufficient concern for their health. More than a third of current smokers (36%) characterize the danger of smoking as only "somewhat harmful," "not too harmful," or "not harmful at all." Only 21% of former smokers and 13% of non-smokers take these positions. Looking at the other end of the scale, the vast majority of non-smokers and former smokers describe the habit as "very harmful," compared with just 60% of smokers.
Of course, whether this knowledge gap between smokers and non-smokers results from true differences in knowledge, or what psychologists would call "cognitive dissonance reduction" (avoiding facing painful facts) on the part of smokers is a key question.
Who Smokes?
Men are slightly more likely than women to smoke cigarettes: 26% of men and 22% of women according to Gallup's July 9-11, 2002, survey. However, a 1998 Gallup poll suggests that when all forms of tobacco use are taken into account -- including cigars and chewing tobacco -- the difference is even wider: 39% of men use tobacco versus 25% of women.
Two of the most significant factors related to smoking are education and age. Only 10% of Americans with a postgraduate education smoke cigarettes. The number rises to 15% among those with a college degree, 26% with only some college education and 30% with no college.
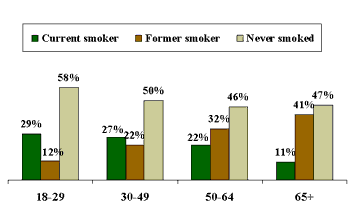
The rate of current smokers drops with age, but many older Americans tell Gallup that they did smoke in the past.
| Smoking History by Age |
 |
| July 9-11, 2002 |
One reason why the incidence of current smokers is so low among those 65 and older could be that few continuing smokers make it into this age group because of smoking-related illnesses. A more heartening explanation, borne out by the large proportion of former smokers in this older age group, is that Americans may pay more attention to health warnings as they get older, and thus become more likely to quit as a result.
Survey Methods
These results are based on telephone interviews with a randomly selected national sample of 1,004 adults, aged 18 and older, conducted July 9-11, 2002. For results based on this sample, one can say with 95% confidence that the maximum error attributable to sampling and other random effects is ±3 percentage points. In addition to sampling error, question wording and practical difficulties in conducting surveys can introduce error or bias into the findings of public opinion polls.
Have you, yourself, smoked any cigarettes in the past week?
|
Yes |
No |
Yes |
No |
|||
|
% |
% |
% |
% |
|||
|
2002 Jul 9-11 |
24 |
76 |
1989 Apr 4-9 |
29 |
71 |
|
|
1988 Jul 1-7 |
32 |
68 |
||||
|
2001 Jul 19-22 |
28 |
72 |
1987 Mar 14-18 |
30 |
70 |
|
|
2000 Nov 13-15 |
25 |
75 |
1986 Jun 9-16 |
31 |
69 |
|
|
1999 Sep 23-26 |
23 |
77 |
1985 Jun 7-10 |
35 |
65 |
|
|
1998 Jun 22-23 |
28 |
72 |
1983 |
38 |
62 |
|
|
1997 Sep 25-28 |
26 |
74 |
1981 Jun 26-29 |
35 |
65 |
|
|
1997 Jun 26-29 |
26 |
74 |
1978 Jan 20-23 |
36 |
64 |
|
|
1997 Jun 23-24 |
26 |
74 |
1977 Aug 19-22 |
38 |
62 |
|
|
1997 May 6-7 |
25 |
75 |
1974 May 10-13 |
40 |
60 |
|
|
1997 Mar 24-26 |
27 |
73 |
1972 Apr 21-24 |
43 |
57 |
|
|
1996 May 9-12 |
27 |
73 |
1971 May 14-17 |
42 |
58 |
|
|
1994 Jul 15-17 |
27 |
73 |
1969 Jul 24-29 |
40 |
60 |
|
|
1994 Mar 11-13 |
27 |
73 |
1957 |
42 |
58 |
|
|
1991 Nov 7-10 |
28 |
72 |
1954 |
45 |
55 |
|
|
1990 Jul 6-8 |
27 |
73 |
1949 |
44 |
56 |
|
|
1989 May 15-18 |
27 |
73 |
1944 |
41 |
59 |
About how many cigarettes do you smoke each day?
BASED ON --213-- SMOKERS
|
Less than |
One |
More than one pack |
No |
Mean |
|
|
% |
% |
% |
% |
% |
|
|
2002 Jul 9-11 |
54 |
29 |
17 |
* |
16 |
|
2001 Jul 19-22 |
59 |
29 |
11 |
* |
15 |
|
2000 Nov 13-15 |
62 |
29 |
9 |
0 |
15 |
|
1999 Sep 23-26 |
55 |
35 |
9 |
1 |
14 |
|
1997 Jun 26-29 |
48 |
32 |
19 |
1 |
-- |
|
1997 Jun 23-24 |
48 |
30 |
21 |
1 |
-- |
|
1996 May 9-12 |
43 |
38 |
16 |
3 |
-- |
|
1994 Mar 11-13 |
44 |
38 |
18 |
0 |
-- |
|
1991 Nov 7-10 |
48 |
34 |
17 |
1 |
-- |
|
1990 Jul 6-8 |
51 |
32 |
14 |
3 |
-- |
|
1989 May 15-18 |
39 |
39 |
20 |
2 |
-- |
|
1988 Jul 1-7 |
40 |
38 |
20 |
2 |
-- |
|
1987 Mar 14-18 |
48 |
32 |
18 |
2 |
-- |
|
1986 Jun 9-16 |
43 |
33 |
22 |
2 |
-- |
|
1981 Jan 26-29 |
38 |
37 |
24 |
1 |
-- |
|
1977 Aug 19-22 |
41 |
31 |
27 |
1 |
-- |
All things considered, would you like to give up smoking, or not?
BASED ON --213-- SMOKERS
|
Yes |
No |
No opinion |
|
|
% |
% |
% |
|
|
2002 Jul 9-11 |
79 |
18 |
3 |
|
2000 Nov 13-15 |
82 |
16 |
2 |
|
1999 Sep 23-26 |
76 |
23 |
1 |
|
1997 Jun 26-29 |
74 |
24 |
2 |
|
1997 Jun 23-24 |
64 |
34 |
2 |
|
1996 May 9-12 |
73 |
26 |
1 |
|
1994 Mar 11-13 |
70 |
28 |
2 |
|
1991 Nov 7-10 |
76 |
22 |
2 |
|
1990 Jul 6-8 |
74 |
24 |
2 |
|
1989 May 15-18 |
63 |
33 |
4 |
|
1988 Jul 1-7 |
68 |
27 |
5 |
|
1987 Mar 14-18 |
77 |
20 |
3 |
|
1986 Jun 9-16 |
75 |
22 |
3 |
|
1981 Jun 26-29 |
66 |
30 |
4 |
|
1977 Aug 19-22 |
66 |
29 |
5 |
As a result of increased restrictions on smoking in public places, do you feel unjustly discriminated against as a smoker, or do you think the restrictions are justified?
BASED ON --213-- SMOKERS
|
|
Yes, unjustly discriminated against |
No, restrictions |
No |
|
% |
% |
% |
|
|
2002 Jul 9-11 |
39 |
58 |
3 |
|
2001 Jul 19-22 |
32 |
65 |
3 |
|
1994 Mar 11-13 |
39 |
60 |
1 |
Would you say you, personally, are smoking less because of these restrictions, or not?
BASED ON --213-- SMOKERS
|
|
Yes, smoking less |
No, not smoking less |
No opinion |
|
% |
% |
% |
|
|
2002 Jul 9-11 |
28 |
71 |
1 |
|
1994 Mar 11-13 |
30 |
70 |
0 |
Did you, yourself, ever smoke cigarettes on a regular basis?
BASED ON --791-- NON-SMOKERS
|
|
Yes |
No |
No answer |
|
2002 Jul 9-11 |
34% |
66% |
* |
