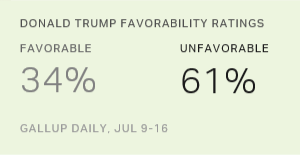
Donald Trump, the Republican Party presidential nominee, has aggressively attacked trade and immigration in his campaign speeches, claiming globalization "has left millions of our workers with nothing but poverty and heartache." This rhetoric, and the weakness of the U.S. economy in recent years, has led many to conclude that his supporters are primarily motivated by economic hardships related to foreign competition.
But an analysis of Gallup Daily tracking survey data from more than 70,000 Americans interviewed between July 2015 and June 2016 who were asked their opinion of Trump finds that the economics of Trump's support are not so clear-cut.
The data show that Americans who have a favorable opinion of Trump are slightly more likely to be employed and no more likely to be out of the labor force than those who see him unfavorably. With no other controls, the overall unemployment rates are 3.2% for those who view Trump favorably versus 3.9% for those who do not; this is a small but statistically significant difference and becomes insignificant among white non-Hispanics. The percentage of adults under 65 years who are out of the labor force is 20% for both those who do and do not hold a favorable opinion of Trump.
Americans with a favorable view of Trump also earn (unadjusted) household incomes that are 6% higher than nonsupporters. Some of this is accounted for by the fact that Republicans, in general, are significantly more likely to be white than Democrats, and whites earn more on average than nonwhites. The income difference between those who see Trump favorably and those who don't does not hold up among white non-Hispanics. White non-Hispanic Americans who view Trump favorably earn somewhat less than other whites who view him unfavorably.
Most who have a favorable opinion of Trump do not hold a bachelor's degree, and this rate is somewhat higher than non-supporters (73% vs. 65%). Available government data show weak income growth for this group.[1] Likewise, Trump supporters are about 50% more likely to work in the blue collar occupations that have been exposed to competition with immigrants and foreign workers (defined here as production, installation, maintenance, repair, transportation or construction) compared with non-supporters. This applies to 14% of all Trump supporters and 22% of male Trump supporters.
In summary, the individual-level data on the relative economic hardship endured by Trump supporters are mixed. Even after controlling for an extensive set of demographic measures, the analysis finds that working in blue collar occupations predicts a more favorable view of Trump, as does being unemployed, but so does earning a higher household income.
Is It the Place or the People in the Place?
Using county primary election voting data, journalists and researchers have noted that Trump voting in the GOP primaries was higher in counties with a high share of jobs in industries like manufacturing, construction and agriculture. People whose demographic characteristics are associated with having a positive opinion of Trump tend to cluster in this sort of county to begin with, however. Thus, it is not clear whether local economic patterns are a causal force in driving Trump favorability, or if people who are inclined to like Trump just happen to live in these areas.
To address this challenge of data interpretation, my analysis combined individual data with geographic data at the levels of ZIP codes and "commuting zones." The full analysis uses multi-variable regression to predict a favorable opinion of Trump, using a mix of personal characteristics and information about the area where the individual respondent lives.
To help understand the analysis in a more intuitive way, consider a prototypical Trump supporter, based on analyses of demographics and other characteristics most often associated with having a favorable opinion of Trump: white, male, over the age of 40, education level of less than a college degree, Christian (but not Mormon) and not gay. The majority (65%) of people with all of these characteristics have a favorable view of Trump, compared with 31% who do not meet these criteria. I then compared Trump favorability for people who meet these criteria of being "likely" Trump supporters who live in different areas. The objective was to see whether the characteristics of the area in which individuals live appear to affect their views of Trump above and beyond what would be predicted by the individual's demographic characteristics alone.
Mexican Immigration Has Little Impact on Those Viewing Trump Favorably
The analysis looked at commuting zones (CZs) that are in the top fifth and the bottom fifth of all commuting zones in the country, ranked by manufacturing orientation, exposure to Chinese imports and exposure to Mexican immigration by virtue of proximity to the U.S.-Mexico border.[2]
If there is something about living in the top fifth of these CZs that causes residents to be more likely to have a favorable view of Trump, then the expectation would be that those with underlying demographic characteristics favorable to Trump and who live in the top fifth of the CZs ranked by the three criteria I listed above would be even more likely to have a favorable opinion of him than others. And those in the bottom fifth, who otherwise fit the description of someone who would have a favorable view of Trump, would be less likely to have a favorable opinion of Trump due to their geography.
This is not the case, however. The analysis shows that individuals who have the demographic characteristic of prototypical Trump supporters are actually less likely to hold a favorable view of Trump if they live in areas with a high share of manufacturing jobs and high exposure to Chinese imports than those living in areas low on these dimensions.
Thus the apparent correlation between Trump support and the manufacturing orientation of a local area is driven, at least in part, by the demographics of those living in the place rather than by the economic characteristics of the place. Older, less-educated white men tend to live in industrial metropolitan areas, but men with these same characteristics are more likely to support Trump if they live in parts of the country that have been relatively sheltered from trade competition or manufacturing decline.
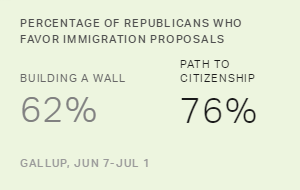
Likewise, Trump has emphasized the need to build a wall on the U.S.-Mexico border, but his support overall and even among likely Trump supporters is actually lower alongside the border and in neighboring areas with high immigrant populations than it is in the distant northern areas that would be least affected by a wall.[3]
Bottom Line
Trump's popularity cannot be neatly linked to economic hardship. Those who do not view Trump favorably appear to have been just as exposed as others, if not more so, to competition with immigrants and foreign workers, and yet are no more likely to say they have a favorable opinion of Trump than others. At the same time, those with a favorable view of Trump do have, to some degree, a lower socio-economic status.
[1] This analysis used IPUMS-CPS microdata from the March supplement and looked at earnings over the period from 2000 to 2015.
[2] Chinese exposure index is from https://www.ddorn.net/data.htm, using data from Daron Acemoglu, David Autor, David Dorn, Gordon H. Hanson, and Brendan Price, "Import Competition and the Great US Employment Sag of the 2000s," Journal of Labor Economics 34:S1 (2016): S141-S198; distance from Mexican border calculated using central point geo-coordinates from the 2010 American Community Survey for the largest county in each CZ and assigning CZs to one of five bins to approximate the nearest border CZ, according to latitude, and calculating the distance from there using the STATA algorithm Vincenty; manufacturing share of employment data are from the Quarterly Census of Employment and Wages, aggregated from counties to CZs.
[3] The correlation across commuting zones between distance from the Mexican border and the share of the population born in Mexico is -0.73. The correlation with the share of the population of Hispanic ethnicity is -0.59. These correlations use 2010-2014 American Community Survey data at the commuting zone level.