WASHINGTON, D.C. -- As gays and lesbians seek rights and acceptance around the world, Gallup surveys conducted in 113 countries find most people unlikely to say the city or area in which they live is a good place for gays and lesbians to live. Across the globe, a median of 24% say the area in which they live is a good place for homosexuals, while a median of 50% feel it is not a good place. The results vary widely by region, with acceptance most likely in the Americas and least likely in Africa.
In Africa, a median of just 8% say the city or area in which they live is a good place for homosexuals, while a median of 77% feel it is not a good place. These responses likely reflect that homosexual acts are illegal in many African countries, with punishments ranging from several years of imprisonment to death. However, it is the opposite in South Africa, considered to be among the more progressive countries in the world on this topic not only because it outlawed discrimination based on sexual orientation in its constitution in 1996, but also because same-sex marriages became legal there in late 2006. In South Africa, 31% of respondents say their city or area is a good place for gays and lesbians, the highest perceived acceptance on the African continent, but still relatively low compared with other countries. Even though homosexual acts are illegal in their country, 26% of Batswana say their cities and areas are good places for homosexuals, sentiment roughly on par with their neighbors in South Africa.
In the Americas, which includes North, Central, and South America and the Caribbean, near parity exists in the median response rate for those who feel their city or area is a good place for gays and lesbians to live (42%) and those who feel it is not a good place (48%). Canada, one of just five countries in the world in which same-sex marriages are legal, reports the highest perceived acceptance: 75% of Canadians say their city or area is a good place for homosexuals to live. Contrary to the traditional view of Latin America as a highly religious, highly conservative region, several Latin American countries also show relatively high perceived acceptance, which is perhaps reflected in the progressive laws and reforms allowing same-sex unions that are being passed and considered at the local and federal level. The countries in the Americas with the least perceived acceptance are found in the Caribbean and include Trinidad and Tobago (17%), Haiti (13%), and Jamaica (6%).
Europeans show relatively high acceptance for gays and lesbians with a regional median response of 32%. Although this is lower than the median response in the Americas (42%), fewer Europeans (29% median) than respondents in the Americas (48% median) call their city or area a poor place for homosexuals to live. Of all regions, Europe has the highest median percentage of respondents who say they do not know whether their community is a good place or not a good place for homosexuals (26%). Three of the five countries in the world that allow same-sex marriages -- the Netherlands (83%), Spain (79%), and Belgium (66%) -- post acceptance scores that are among the highest in the world. Southeast Europeans (15% median for this sub-region) are the least likely in Europe to say their communities are good places for homosexuals, and several countries and areas in this sub-region post scores in the single digits, such as Albania (7%) and Kosovo (6%).
The median response in Asia matches the worldwide median response of 24%. New Zealand (70%) and Australia (67%) stand out in the region as having the highest perceived acceptance of gays and lesbians, while three-quarters of Palestinians (79%), Armenians (75%), and Malaysians (74%) say the city or area in which they live is not a good place for homosexuals to live.

Wellbeing
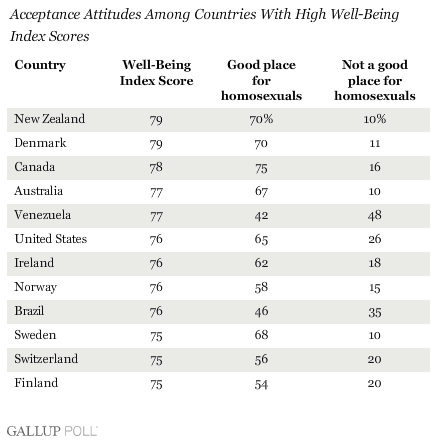
Several of the countries with the highest Well-Being Index scores are also some of the countries with the highest acceptance of gays and lesbians among the countries surveyed.

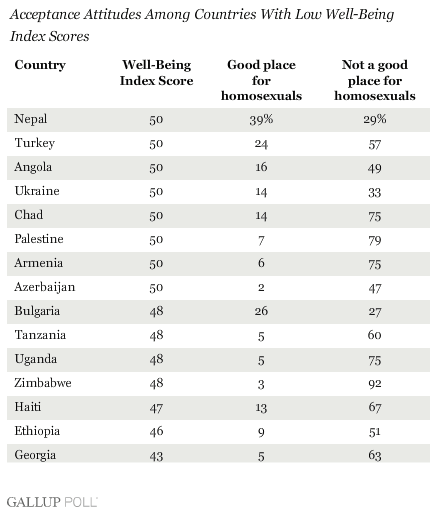
Conversely, several of those countries with the lowest Well-Being Index scores are also some of the countries with lowest acceptance for gays and lesbians.

Survey Methods
Results are based on telephone and face-to-face interviews conducted from 2005 to 2007. Randomly selected sample sizes typically number 1,000 residents, aged 15 and older, in the countries polled. For results based on samples of this size, one can say with 95% confidence that the maximum error attributable to sampling and other random effects is ±3 percentage points. In addition to sampling error, question wording and practical difficulties in conducting surveys can introduce error or bias into the findings of public opinion polls.
|
Country |
Good |
Not a |
(DK) |
(Refused) |
|
|
% |
% |
% |
% |
|
Netherlands |
83 |
9 |
8 |
0 |
|
Spain |
79 |
12 |
10 |
0 |
|
Canada |
75 |
16 |
8 |
1 |
|
Uruguay |
71 |
19 |
9 |
1 |
|
New Zealand |
70 |
10 |
20 |
0 |
|
Denmark |
70 |
11 |
19 |
0 |
|
Sweden |
68 |
10 |
21 |
0 |
|
Australia |
67 |
10 |
21 |
1 |
|
Belgium |
66 |
10 |
24 |
0 |
|
United States |
65 |
26 |
8 |
1 |
|
United Kingdom |
64 |
10 |
26 |
0 |
|
France |
63 |
11 |
26 |
1 |
|
Ireland |
62 |
18 |
19 |
0 |
|
Norway |
58 |
15 |
27 |
0 |
|
Switzerland |
56 |
20 |
24 |
0 |
|
Hong Kong |
56 |
35 |
9 |
0 |
|
Germany |
55 |
18 |
26 |
1 |
|
Cuba |
54 |
20 |
25 |
-- |
|
Puerto Rico |
54 |
31 |
15 |
1 |
|
Finland |
54 |
20 |
26 |
-- |
|
Nicaragua |
52 |
38 |
9 |
1 |
|
Italy |
51 |
26 |
23 |
0 |
|
Philippines |
51 |
41 |
8 |
0 |
|
Argentina |
51 |
32 |
16 |
1 |
|
Colombia |
47 |
43 |
9 |
1 |
|
Chile |
47 |
42 |
10 |
1 |
|
Mexico |
47 |
39 |
14 |
0 |
|
Brazil |
46 |
35 |
18 |
0 |
|
Guatemala |
44 |
48 |
7 |
1 |
|
Venezuela |
42 |
48 |
8 |
1 |
|
Czech Republic |
40 |
25 |
32 |
3 |
|
Panama |
40 |
46 |
13 |
1 |
|
Nepal |
39 |
29 |
30 |
2 |
|
Portugal |
36 |
30 |
33 |
1 |
|
Honduras |
35 |
56 |
8 |
0 |
|
Singapore |
35 |
44 |
21 |
1 |
|
Austria |
34 |
29 |
36 |
1 |
|
Greece |
34 |
48 |
17 |
1 |
|
Laos |
34 |
53 |
11 |
2 |
|
Latvia |
33 |
33 |
30 |
4 |
|
El Salvador |
33 |
53 |
14 |
0 |
|
Hungary |
32 |
20 |
47 |
1 |
|
Costa Rica |
32 |
53 |
15 |
1 |
|
South Africa |
31 |
44 |
24 |
1 |
|
Taiwan |
31 |
49 |
20 |
0 |
|
Ecuador |
31 |
63 |
6 |
0 |
|
Thailand |
30 |
51 |
17 |
2 |
|
Paraguay |
30 |
49 |
21 |
0 |
|
Slovenia |
29 |
49 |
21 |
1 |
|
Peru |
29 |
52 |
15 |
3 |
|
Cyprus |
29 |
49 |
17 |
5 |
|
Israel |
27 |
56 |
15 |
2 |
|
Bolivia |
27 |
52 |
19 |
2 |
|
Botswana |
26 |
59 |
14 |
0 |
|
Bulgaria |
26 |
27 |
45 |
3 |
|
Lebanon |
25 |
64 |
10 |
1 |
|
Slovakia |
24 |
37 |
35 |
3 |
|
Turkey |
24 |
57 |
16 |
3 |
|
Lithuania |
24 |
35 |
39 |
2 |
|
Dominican Republic |
24 |
66 |
10 |
1 |
|
Estonia |
23 |
24 |
50 |
3 |
|
Poland |
23 |
50 |
26 |
0 |
|
Cambodia |
23 |
62 |
15 |
0 |
|
Croatia |
23 |
53 |
23 |
2 |
|
Serbia |
22 |
55 |
20 |
3 |
|
Romania |
19 |
49 |
30 |
3 |
|
Moldova |
18 |
48 |
30 |
4 |
|
Trinidad & Tobago |
17 |
68 |
14 |
1 |
|
Benin |
17 |
67 |
14 |
2 |
|
Belarus |
17 |
24 |
55 |
3 |
|
Angola |
16 |
49 |
27 |
7 |
|
Russia |
15 |
32 |
50 |
3 |
|
Montenegro |
15 |
64 |
19 |
2 |
|
South Korea |
15 |
54 |
31 |
0 |
|
Sierra Leone |
15 |
83 |
2 |
-- |
|
Macedonia |
15 |
73 |
11 |
2 |
|
Ukraine |
14 |
33 |
46 |
6 |
|
Chad |
14 |
75 |
8 |
3 |
|
Burundi |
14 |
67 |
17 |
2 |
|
Haiti |
13 |
67 |
17 |
2 |
|
Mali |
13 |
78 |
8 |
1 |
|
Nigeria |
12 |
72 |
16 |
0 |
|
Bosnia & Herzegovina |
10 |
70 |
17 |
3 |
|
Malaysia |
10 |
74 |
12 |
4 |
|
Rwanda |
10 |
67 |
22 |
0 |
|
Sri Lanka |
9 |
30 |
39 |
22 |
|
Togo |
9 |
83 |
8 |
0 |
|
Ghana |
9 |
79 |
12 |
0 |
|
Ethiopia |
9 |
51 |
31 |
9 |
|
Mozambique |
8 |
85 |
7 |
0 |
|
Burkina Faso |
8 |
77 |
12 |
3 |
|
Malawi |
8 |
87 |
5 |
0 |
|
Niger |
7 |
90 |
3 |
0 |
|
Palestine |
7 |
79 |
10 |
3 |
|
Cameroon |
7 |
84 |
8 |
0 |
|
Albania |
7 |
54 |
30 |
9 |
|
Zambia |
7 |
80 |
12 |
1 |
|
Senegal |
6 |
76 |
12 |
6 |
|
Jamaica |
6 |
70 |
23 |
1 |
|
Madagascar |
6 |
84 |
7 |
3 |
|
Kyrgyzstan |
6 |
70 |
23 |
1 |
|
Vietnam |
6 |
67 |
26 |
1 |
|
Kosovo |
6 |
66 |
22 |
6 |
|
Armenia |
6 |
75 |
16 |
3 |
|
Kenya |
6 |
69 |
24 |
1 |
|
Tanzania |
5 |
60 |
24 |
10 |
|
Georgia |
5 |
63 |
26 |
6 |
|
Indonesia |
5 |
71 |
20 |
5 |
|
Afghanistan |
5 |
56 |
14 |
25 |
|
Uganda |
5 |
75 |
19 |
2 |
|
Mauritania |
4 |
94 |
2 |
0 |
|
Zimbabwe |
3 |
92 |
5 |
-- |
|
Azerbaijan |
2 |
47 |
34 |
17 |
