PRINCETON, NJ -- The political climate continues to look positive for Sen. Hillary Rodham Clinton. Not only is she holding a considerable lead for the 2008 Democratic presidential nomination (chosen by more than 2 to 1 over second-place contender Sen. Barack Obama), but she has once again moved slightly ahead of the Republican front-runner, Rudy Giuliani, in Gallup’s national ballot for the general election.
According to the latest USA Today/Gallup poll, conducted Nov. 2-4, Clinton now leads Giuliani by six percentage points -- 51% to 45% -- as the candidate more registered voters would support for president next November. This is a change from August, when Clinton trailed Giuliani by four points.
More generally, Gallup’s trial-heat polls pitting Clinton against Giuliani have shown the race to be tight all year, with the “lead” changing several times back and forth between the two. Giuliani had small leads in polls conducted in February, April, and early June. Clinton moved into the lead in a mid-June poll. Giuliani regained the lead in August; and now Clinton is ahead. None of these leads has been large.
Clinton and Giuliani currently receive the same level of support from members of their own party on this two-way ballot. Eighty-nine percent of Democratic registered voters prefer Clinton for president while 88% of Republicans choose Giuliani. Independents break about evenly, with 48% for Giuliani and 46% for Clinton. Clinton’s lead in the poll is due to the somewhat greater proportion of Americans calling themselves Democrats than Republicans in this survey.
Some Added Assurance for Clinton
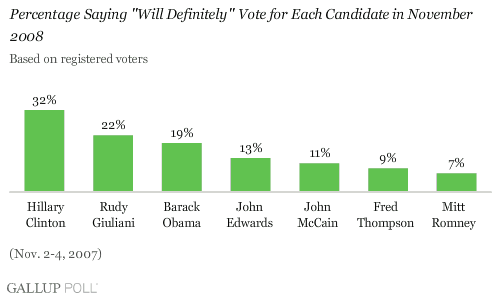
The current poll also included a measure of the likelihood that Americans would vote for each of seven presidential candidates in the general election. At 32%, Clinton is the recipient of the highest percentage saying they will “definitely” vote for her -- money in the bank, as it were. That is a high percentage considering the party nominations have not even been decided yet, perhaps indicating that voters are more certain of Clinton winning her party’s nomination than of anyone else earning a spot on the ballot next fall.
Both Giuliani and Obama run at least 10 points behind Clinton on this early indicator of electoral strength, with 22% and 19%, respectively, saying they will definitely vote for each.
The even lower percentages for former Sen. John Edwards, Sen. John McCain, former Sen. Fred Thompson, and former Gov. Mitt Romney on this measure follow the rank order in which they are chosen for their respective party nominations in the same poll. (See “Election 2008 Topics and Trends” in Related Items.)
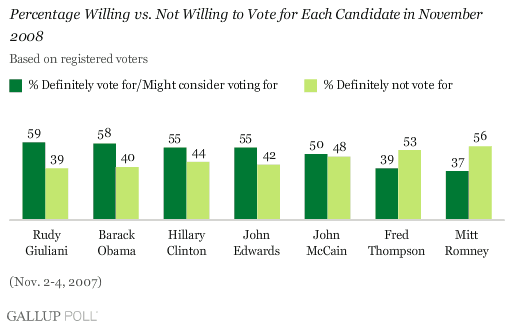
Edwards and McCain both get a considerable boost from those saying they might consider supporting each in the general election, putting them in roughly the same range as their respective parties’ front-runners.
Thompson and Romney lag well behind, with no more than 39% of voters identifying themselves as potential voters for each. A majority of Americans put themselves into the “definitely not vote for” column for each. However, a standard caveat applies to interpreting their ratings: both Thompson and Romney are much less well known than the other leading contenders for the Democratic and Republican nominations, and thus, they are at a disadvantage on all candidate strength measures. In principle, they could become more competitive if and when they become better known during the campaign.
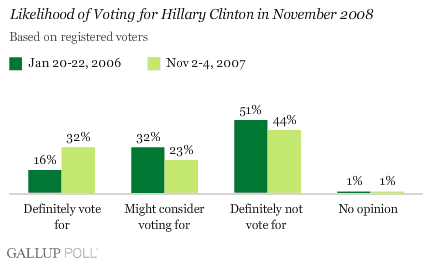
Gallup had previously asked this voting likelihood question about Clinton in a January 2006 survey. At that time, only half as many registered voters said they would definitely vote for her as say this today. Slightly more said they might consider voting for her than do today, but the net difference was a more negative picture than in the current poll.
Nearly two years ago, 48% said they would definitely or possibly vote for Clinton for president; today that figure is 55%. Conversely, it would seem Clinton has crossed an important electability threshold, with only 44% of voters now (compared with 51% in January 2006) saying they would definitely not vote for her.
Bottom Line
Despite currently trailing in the head-to-head matchup with Clinton, Giuliani has as deep a well as Clinton’s, if not deeper, into which to dip for voters, but he needs to do a better job of dipping. That is the essence of what Gallup’s latest set of national election figures says about the election.
Nearly 6 in 10 voters express a willingness to vote for Giuliani next November, compared with Clinton’s 55%. Yet Giuliani currently trails her by six percentage points in Gallup’s head-to-head ballot test. A key problem for him is that he is attracting a much smaller share of his potential voters than Clinton is.
Results are based on telephone interviews with 1,024 national adults, aged 18 and older, conducted Nov. 2-4, 2007. For results based on the total sample of national adults, one can say with 95% confidence that the maximum margin of sampling error is ±3 percentage points.
For results based on the sample of 932 registered voters, the maximum margin of sampling error is ±4 percentage points.
In addition to sampling error, question wording and practical difficulties in conducting surveys can introduce error or bias into the findings of public opinion polls.
18. Suppose the 2008 presidential election were being held today. If Hillary Clinton were the Democratic Party's candidate and Rudy Giuliani were the Republican Party's candidate, who would you vote for -- [ROTATED: Hillary Clinton, the Democrat (or) Rudy Giuliani, the Republican]?
18A. (Asked of those who are undecided) As of today, do you lean more toward -- [ROTATED: Clinton, the Democrat (or) Giuliani, the Republican]?
|
|
|
|
OTHER
|
NEITHER
|
No
|
|
Registered voters |
% |
% |
% |
% |
% |
|
2007 Nov 2-4 |
51 |
45 |
1 |
2 |
1 |
|
2007 Aug 13-16 |
46 |
50 |
* |
3 |
1 |
|
2007 Jun 11-14 |
50 |
46 |
* |
2 |
1 |
|
2007 Jun 1-3 |
45 |
52 |
1 |
2 |
1 |
|
2007 Apr 13-15 |
46 |
51 |
* |
2 |
1 |
|
2007 Feb 9-11 |
48 |
50 |
-- |
1 |
1 |
|
2005 Jul 25-28 |
45 |
50 |
1 |
2 |
2 |
|
|
|
|
|
|
|
|
National adults |
|
|
|
|
|
|
2007 Nov 2-4 |
51 |
45 |
1 |
2 |
1 |
|
2007 Aug 13-16 |
47 |
49 |
* |
3 |
1 |
|
2007 Jun 11-14 |
50 |
45 |
* |
3 |
1 |
|
2007 Jun 1-3 |
45 |
50 |
1 |
2 |
2 |
|
2007 Apr 13-15 |
46 |
51 |
* |
2 |
1 |
|
2007 Feb 9-11 |
49 |
48 |
-- |
1 |
1 |
|
2005 Jul 25-28 |
44 |
51 |
* |
2 |
3 |
|
* Less than 0.5% |
|||||
|
(vol.) = Volunteered response |
|||||
19. For each of the following presidential candidates, please tell me whether you will definitely vote for that person in November 2008, whether you might consider voting for that person, or whether you will definitely not vote for that person. How about -- [RANDOM ORDER]?
|
2007 Nov 2-4
|
Definitely
|
Will definitely
|
Might consider
|
Definitely not
|
|
|
% |
% |
% |
% |
|
Rudy Giuliani |
59 |
22 |
37 |
39 |
|
Barack Obama |
58 |
19 |
39 |
40 |
|
Hillary Clinton |
55 |
32 |
23 |
44 |
|
John Edwards |
55 |
13 |
42 |
42 |
|
John McCain |
50 |
11 |
39 |
48 |
|
Fred Thompson |
39 |
9 |
30 |
53 |
|
Mitt Romney |
37 |
7 |
30 |
56 |
Full Results and Trends:
A. Hillary Clinton
|
|
Definitely
|
Might consider
|
Definitely
|
No
|
|
Registered voters |
% |
% |
% |
% |
|
2007 Nov 2-4 |
32 |
23 |
44 |
1 |
|
2006 Jan 20-22 |
16 |
32 |
51 |
1 |
|
|
|
|
|
|
|
National adults |
|
|
|
|
|
2007 Nov 2-4 |
33 |
24 |
43 |
1 |
|
2006 Jan 20-22 |
17 |
33 |
49 |
1 |
B. John Edwards
|
|
Definitely
|
Might consider
|
Definitely
|
No
|
|
Registered voters |
% |
% |
% |
% |
|
2007 Nov 2-4 |
13 |
42 |
42 |
3 |
|
|
|
|
|
|
|
National adults |
|
|
|
|
|
2007 Nov 2-4 |
13 |
40 |
44 |
3 |
C. Rudy Giuliani
|
|
Definitely
|
Might consider
|
Definitely
|
No
|
|
Registered voters |
% |
% |
% |
% |
|
2007 Nov 2-4 |
22 |
37 |
39 |
2 |
|
|
|
|
|
|
|
National adults |
|
|
|
|
|
2007 Nov 2-4 |
22 |
37 |
39 |
2 |
D. John McCain
|
|
Definitely
|
Might consider
|
Definitely
|
No
|
|
Registered voters |
% |
% |
% |
% |
|
2007 Nov 2-4 |
11 |
39 |
48 |
2 |
|
|
|
|
|
|
|
National adults |
|
|
|
|
|
2007 Nov 2-4 |
11 |
38 |
49 |
2 |
E. Barack Obama
|
|
Definitely
|
Might consider
|
Definitely
|
No
|
|
Registered voters |
% |
% |
% |
% |
|
2007 Nov 2-4 |
19 |
39 |
40 |
2 |
|
|
|
|
|
|
|
National adults |
|
|
|
|
|
2007 Nov 2-4 |
19 |
38 |
40 |
3 |
F. Mitt Romney
|
|
Definitely
|
Might consider
|
Definitely
|
No
|
|
Registered voters |
% |
% |
% |
% |
|
2007 Nov 2-4 |
7 |
30 |
56 |
6 |
|
|
|
|
|
|
|
National adults |
|
|
|
|
|
2007 Nov 2-4 |
6 |
30 |
57 |
7 |
G. Fred Thompson
|
|
Definitely
|
Might consider
|
Definitely
|
No
|
|
Registered voters |
% |
% |
% |
% |
|
2007 Nov 2-4 |
9 |
30 |
53 |
8 |
|
|
|
|
|
|
|
National adults |
|
|
|
|
|
2007 Nov 2-4 |
9 |
30 |
54 |
8 |
