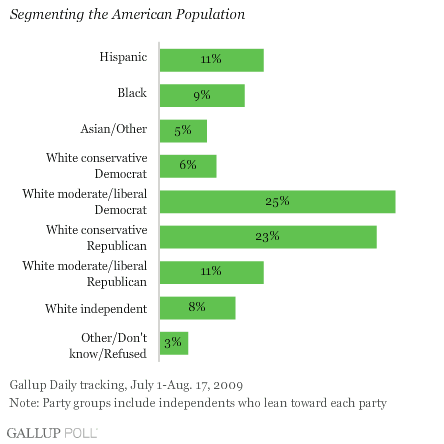
PRINCETON, NJ -- Conservative white Democrats and moderate/liberal white Republicans are relatively rare creatures in the contemporary American political environment; 6% of Americans meet the former definition, and 11% the latter. Almost half of Americans, on the other hand, fit into the more conventional segments of moderate/liberal white Democrats or conservative white Republicans.

There has been a good deal of discussion recently about the polarization of American politics -- the division of the body politic into battling camps of left-leaning Democrats and right-leaning Republicans, with few members of either party occupying the middle. In some observers' opinions, this contrasts with previous eras, during which there was more ideological diversity within the ranks of those who identified with each major party. Although some of this discussion focuses on the composition of the House and Senate, it is of parallel interest to look at the state of the overall American population along these same political and ideological lines.
The current Gallup analysis examines more than 47,000 interviews Gallup conducted from July to mid-August 2009, and focuses primarily on the combination of party and ideology among the 72% of American adults who are non-Hispanic whites. (The ideology and partisanship of blacks, Hispanics, and other ethnic and racial groups will be examined in future Gallup analyses.)
As seen above, white Americans indeed tend to group themselves into what can be called conventional political categories: Democrats (including independents who lean Democratic) who are moderate or liberal, and Republicans (including independents who lean Republican) who are conservative. Of all white Democrats, those who are moderate or liberal outnumber conservatives (sometimes called Blue Dog Democrats) by a 4-to-1 margin. On the other side of the political spectrum, by way of comparison, conservative Republicans outnumber moderate/liberal Republicans by a better-than 2-to-1 margin. A small segment of white Americans are "pure" independents who do not lean toward either political party.
Who Are the Conservative Democrats?
Generally, the ratio of conservative white Democrats to moderate/liberal white Democrats is highest in the following groups:
-
Older Americans
-
Less well-educated Americans
-
Lower-income Americans
-
More religious Americans
In short, the universe of white Democrats in these population segments skews disproportionately toward conservative Democrats. There are no significant differences by gender, and only in the West are conservative Democrats somewhat less likely to be found on a proportionate basis than in other regions of the country.

Who Are the Moderate/Liberal Republicans?
Moderate/liberal white Republicans have a proportionately larger share of the following segments of the Republican population:
-
Women
-
Less well-educated Americans
-
Those with lower incomes
-
Those living in the East
-
The young
-
Those for whom religion is not important

Presidential Job Approval
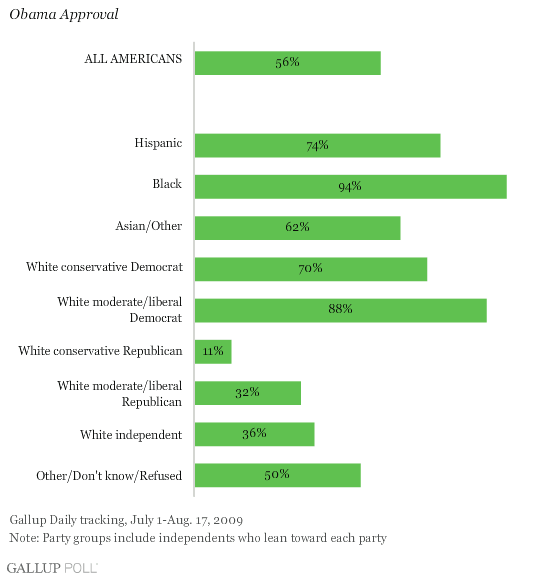
These overall partisan and ideological groupings are, not unexpectedly, significant predictors of presidential job approval.

Among the population segments that form the basis of this analysis, moderate/liberal white Democrats give President Obama the highest average job approval. Conservative Democrats still strongly approve of Obama, but at a significantly lower average level than do their fellow Democrats who are moderate or liberal.
On the other side of the spectrum, while well less than a majority of all white Republicans approve of Obama, those who are unconventional in the sense of being moderate or liberal are about three times as likely to approve as are those who are more conventionally conservative.
As noted in the accompanying graph, the highest average job approval rating for President Obama during this July 1-Aug. 17 time period comes among black Americans (regardless of party or ideology).
Survey Methods
For Gallup Daily tracking, Gallup interviews approximately 1,000 national adults, aged 18 and older, each day. The data analyzed in this report are based on a sample of 47,413 national adults, aged 18 and older, interviewed between July 1 and Aug. 17, 2009. For this total sample, one can say with 95% confidence that the maximum margin of sampling error is ±1 percentage points.
Interviews are conducted with respondents on land-line telephones (for respondents with a land-line telephone) and cellular phones (for respondents who are cell-phone only).
In addition to sampling error, question wording and practical difficulties in conducting surveys can introduce error or bias into the findings of public opinion polls.
