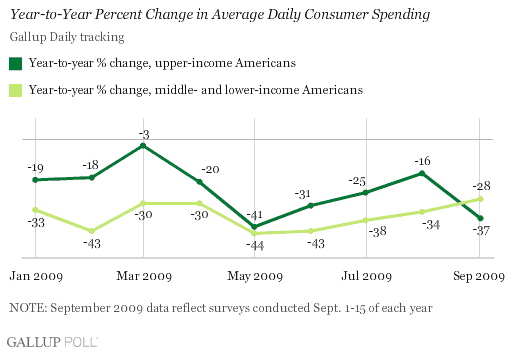
PRINCETON, NJ -- Despite a $2 trillion increase in U.S. household wealth last quarter, upper-income Americans' self-reported average daily spending in stores, restaurants, gas stations, and online is down 37% in the first half of September from September of a year ago. This decline -- which is worse than the 28% decline in spending among middle- and lower-income Americans, and is worse than the August upper-income decline -- is not good news, especially for upscale retailers and big-ticket-item sales.

"Gallup's consumer spending data show the new normal for 2009 remains intact, with actual dollar spending staying in a tight range regardless of income, and overall spending down sharply from a year ago."
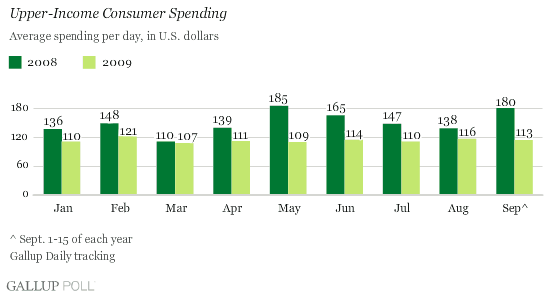
Gallup finds Americans who earn $90,000 or more a year spending $3 less per day during the first half of September ($113) than they did in August ($116). This puts upper-income spending so far this month in the same $14 range ($107 to $121) that it has occupied throughout 2009, reinforcing the idea that there is a new normal in upper-income consumer spending. However, when year-ago spending over the same period ($180) is used as a seasonal adjustment, upper-income spending is off 37% from Sept. 1-15, 2008. That 37% year-to-year change represents the largest decline Gallup has seen in any month since May. It should be noted that year-ago comparables for May are artificially high due to last year's relatively large tax rebates and their positive, if temporary, impact on consumer spending. Of course, this effect was mitigated somewhat in this instance because the rebates were phased out for many upper-income consumers.

Middle- and Lower-Income Spending
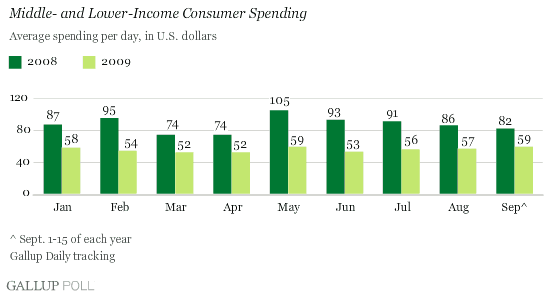
During the first half of September, Gallup's consumer spending measure for middle- and lower-income consumers shows an increase to $59 per day, compared with $57 during August. Spending among these consumers remains in a tight $7 range ($52 to $59) and, as is the case with upper-income consumers, the spending pattern appears to be a new normal. Sept. 1-15 spending by these consumers is down 28% from a year ago -- not as large as the early September decline in upper-income spending but consistent with the declines for middle- and lower-income consumers throughout 2009.

Implications
Early this week, Federal Reserve Board Chairman Ben Bernanke declared that the U.S. recession is probably over. On Wednesday, the Fed reported that industrial production increased for the second month in a row, and on Thursday, the Fed's Flow of Funds data revealed that Americans during the second quarter of this year gained wealth for the first time in seven quarters. All of this positive economic news seemed to reinforce the optimism on Wall Street, as the equity markets had another good week.
In contrast, Gallup's consumer spending data show the new normal for 2009 remains intact, with actual dollar spending staying in a tight range regardless of income, and overall spending down sharply from a year ago. More worrisome, upper-income spending in September seems to be trailing even further behind last year's comparables. In turn, this suggests that the $2 trillion increase in net worth that would presumably affect upper-income spending the most has instead had essentially no effect.
Of course, it may be that gains in wealth during the second quarter were distributed differently than the losses that preceded them. Further, it could be that for many consumers, this increase in wealth still left them with huge losses, compared with their peak net worth. Although it is not fashionable to discuss, the financial crisis had an enormous negative impact on upper-income Americans, as illustrated by the fact that U.S. household wealth remains more than $11 trillion below its third-quarter 2007 peak.
A meaningful economic recovery in the immediate term will require an upturn in spending -- particularly among upper-income consumers -- during the coming holiday season. At this point, the spending new normal suggests that even as household wealth is increasing, this needed upturn may not be materializing.
Survey Methods
For Gallup Daily tracking, Gallup interviews approximately 1,000 national adults, aged 18 and older, each day. The Gallup consumer spending results are based on random half-samples of approximately 500 national adults, aged 18 and older, each day. Results for Sept. 1-15, 2008, and Sept. 1-15, 2009, for middle- and lower-income consumers combined (those making less than $90,000 per year) are based on telephone interviews with 4,598 and 7,631 adults, respectively. For these results, one can say with 95% confidence that the maximum margin of sampling error is ±2 percentage points. Results for Sept. 1-15, 2008, and Sept. 1-15, 2009, for upper-income consumers (those making $90,000 or more per year) are based on telephone interviews with 1,242 and 2,402 adults, respectively, with a maximum margin of error of ±3 percentage points.
Interviews are conducted with respondents on land-line telephones (for respondents with a land-line telephone) and cellular phones (for respondents who are cell-phone only).
In addition to sampling error, question wording and practical difficulties in conducting surveys can introduce error or bias into the findings of public opinion polls.
