PRINCETON, NJ -- Of the 50 states, Hawaii gave its native son, President Barack Obama, the highest approval ratings in 2009, with an average of nearly 71% approving of his overall job performance from January through December. Only the District of Columbia delivered a higher average approval rating for Obama, at 90.2%. Neighboring Maryland also ranks high among state approval ratings for the president, with an average of 68.5%.


Obama's home state -- Illinois -- was among the most favorable to him last year, with 65.2% approving. Aside from California and New York, the remaining states in Obama's top 10 are all in New England (Vermont, Massachusetts, Connecticut, and Rhode Island).
Hawaii also delivered the highest share of the vote for Obama in the 2008 presidential election of any state (though D.C. was higher). However, all top 10 Obama approval states voted for him in that election, and all are solidly blue in the party identification of their residents.
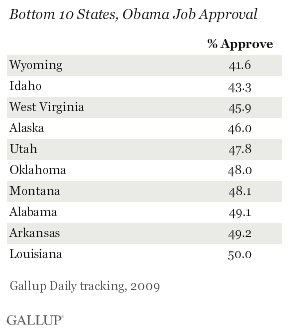
Obama's overall average approval rating in 2009 was 57.6% (slightly different from the 57% Gallup calculated for his first year, spanning Inauguration Day through Jan. 19, 2010), and he averaged better than 50% approval in 41 states, including Washington, D.C. The states where no more than half approved also represent the bottom 10 states for him. Among these, Wyoming gave Obama his lowest average approval, 41.6%, followed by Idaho with 43.3%. Many of the other least-approving states were in the South (Louisiana, Arkansas, Alabama) or West (Montana, Utah, Alaska). Oklahoma is the lone Midwestern state in this category, and West Virginia the lone Eastern state. All of these states voted for John McCain in 2008.
A separate breakdown of the states into three categories finds 21 states giving Obama an approval rating within three percentage points of his national average for all of 2009 (between 54.6% and 60.6%). Thirteen states had an average approval rating of Obama above that range and 17 states fell below it.
The 2009 state-level approval figures are based on combined data for Gallup Daily tracking from Jan. 21 (the day after Obama was sworn in) through Dec. 31, 2009. The presidential approval question is asked of a random half-sample of approximately 500 national adults each night, resulting in more than 170,000 interviews for the entire year. The state sample sizes range from 301 in the District of Columbia and 422 in Wyoming to 17,887 in California. Forty-one states had more than 1,000 respondents. (See full table at end of this report.)
Extent to Which Approval Exceeds Democratic Party ID Varies
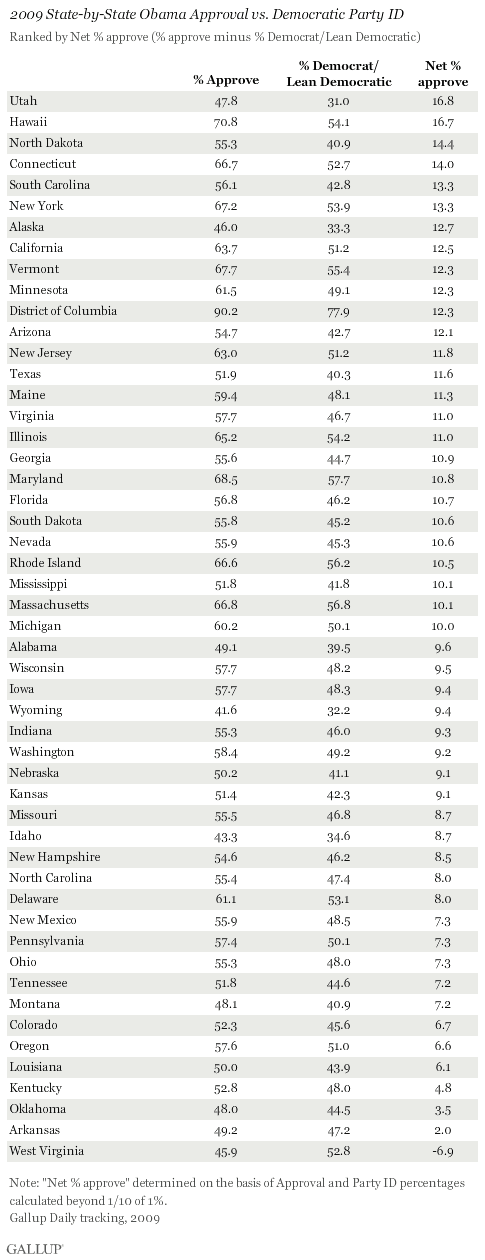
Obama's average state-level approval ratings are related to each state's partisan makeup, as would be expected. States with a high proportion of self-identified Democrats tend to be more supportive of Obama than those with lower proportions of Democrats; however, there is not a 1-to-1 correspondence between the two figures.
Because a certain proportion of non-Democrats (that is, Republicans and independents) approve of the president's job performance, Obama's approval rating in each state in 2009 was, on average, about 10 points higher than the percentage calling themselves Democrats (including independents who lean Democratic). However, his average approval rating was significantly more than 10 points ahead of Democratic Party ID in several states, and significantly less than 10 points ahead of it in others.
More specifically, Obama's average approval rating was more than 16 points greater than Democratic Party identification in Utah and Hawaii, and about 14 points greater in North Dakota and Connecticut.
By contrast, his approval rating was less than 7 points ahead of Democratic Party ID in Arkansas, Oklahoma, Kentucky, Louisiana, Oregon, and Colorado. And in West Virginia, Obama's approval rating was nearly 7 points lower than the percentage of Democrats state-wide, the only state showing this pattern.

Bottom Line
How the residents of each state view Obama continues to be strongly related to 2008 voting patterns. Approval toward him was particularly high in the states that gave him the most support in the 2008 election -- led by Hawaii and Washington, D.C. His lowest support as president came from states that voted strongly for John McCain -- particularly Wyoming and a number of other Western as well as Southern states.
Gallup's "State of the States" series reveals state-by-state differences on political, economic, and wellbeing measures Gallup tracks each day. New stories will be released throughout the month of February.
Survey Methods
Results are based on telephone interviews with 170,370 national adults, aged 18 and older, conducted Jan. 21-Dec. 31, 2009, as part of Gallup Daily tracking. For results based on the total sample of national adults, one can say with 95% confidence that the maximum margin of sampling error is ±1 percentage points.
The margin of error for most states is ±3 percentage points, but is as high as ±7 percentage points for the District of Columbia. For the most populous states, the margin of error is ±1 percentage point.
Interviews are conducted with respondents on land-line telephones and cellular phones.
In addition to sampling error, question wording and practical difficulties in conducting surveys can introduce error or bias into the findings of public opinion polls.

