PRINCETON, NJ -- As White House and congressional leaders prepare for their bipartisan summit on healthcare on Feb. 25, a new Gallup Daily tracking analysis reinforces the wide degree of variability in health insurance coverage across U.S. population segments. Health insurance coverage is generally lowest in Americans' mid-twenties and strongly related to income, ranging from a low of 44% among 35-year-olds making less than $24,000 a year to 100% among seniors in their 70s making more than $24,000 a year.
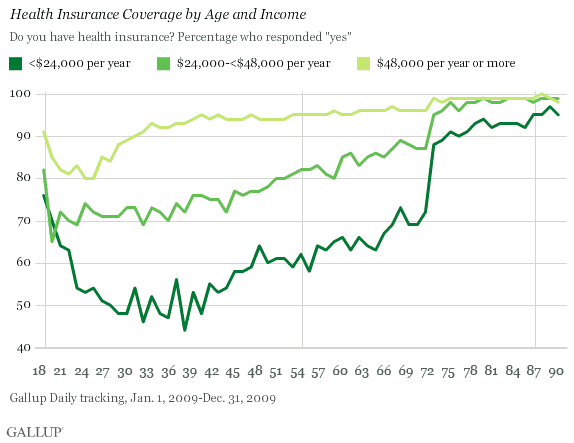
Gallup's health insurance data is based on 353,849 interviews conducted among national adults, aged 18 and older, across all 50 states and the District of Columbia in 2009 as part of the Gallup Healthways Well Being Index. This large number of interviews provides an unprecedented opportunity to examine the health insurance status of Americans on a year-to-year basis from ages 18-90.
Nationally, an average of 16.2% of all Americans did not have health insurance when Gallup interviewed them in 2009. This marks a slight uptick from 2008, the first year Gallup collected comprehensive data on health insurance coverage.
As is true with many aspects of American life today, the lack of health insurance is not distributed equally or randomly. There is a distinct age and income pattern when it comes to those who have health insurance. The data also show the role that the government's national Medicaid, Medicare, and military health insurance programs play in patterns of healthcare coverage, germane to the current debate over healthcare reform.
Health Insurance Coverage by Age
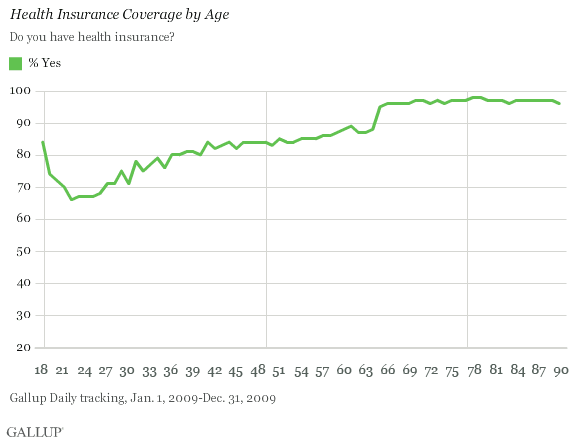
Among 18-year-olds, the youngest Americans Gallup surveys, 84% have health insurance. This relatively high rate of coverage presumably reflects the fact that these young Americans are still covered under their parents' insurance policies, something that apparently changes abruptly as they grow into their early 20s. Health insurance coverage reaches the lowest point of the entire age spectrum (66%) at age 22. From age 22 on, the percentage of Americans with health insurance begins to climb, albeit slowly, reaching the 95% level at age 65 when Medicare coverage is officially available.
Health Insurance Coverage by Type
Overall, 46.8% of Americans in 2009 reported having health insurance paid for privately (employer or union); 24.6% report having Medicaid, Medicare, or military/veterans' insurance; and 11.1% report having some other type of insurance.
The distribution of these sources of health insurance differs dramatically by age.
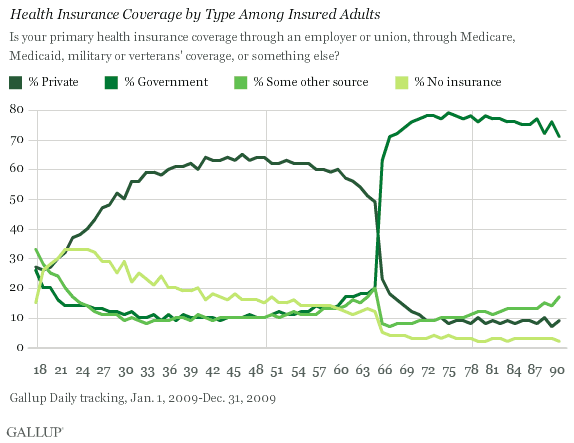
In addition to their relatively high levels of no health insurance coverage at all, Americans in their early 20s are also above average in reporting that they have "some other source" of health insurance. No doubt this reflects coverage under parents' plans and colleges or other school coverage. (There is also a relatively high percentage of the young group who report Medicaid, Medicare, or military coverage.) As age increases, the percentage of Americans with either no insurance or "other" insurance drops, and the percentage who have insurance paid for by an employer or union climbs. The high point for employer-paid insurance -- 64% -- comes in Americans' 40s.
Government-paid and "other" insurance sources begin to rise among Americans in their 50s and early 60s. The effect of government-based healthcare is dramatically evident among Americans aged 65 and older. The percentage of Americans with Medicare, Medicaid, or military-paid insurance jumps from 20% at age 64 to 71% at age 66. Interestingly, the percentage of older Americans who report Medicare, Medicaid, or military insurance never quite reaches 80%, regardless of age. Small percentages of older Americans in their 70s and 80s continue to report having employer-paid or "other" insurance.
Health Insurance Coverage by Income
It comes as no surprise to find that health insurance coverage is related to income. The massive size of Gallup's 2009 database of interviews helps clarify the precise age-related nature of this relationship.
The finding that overall insurance coverage increases with age is also evident within each income group. Even after age 65, when most Americans become eligible for Medicare, those with higher incomes are more likely to have health insurance than those with lower incomes. At the same time, stark differences in health coverage by income remain -- regardless of age.
Americans Making Less Than $24,000 a Year
The reality of health insurance coverage for those making less than $24,000 a year is one of either no coverage at all or a relatively high level of reliance on government insurance. Relatively few of these low-income Americans have employee-paid insurance at any age point.
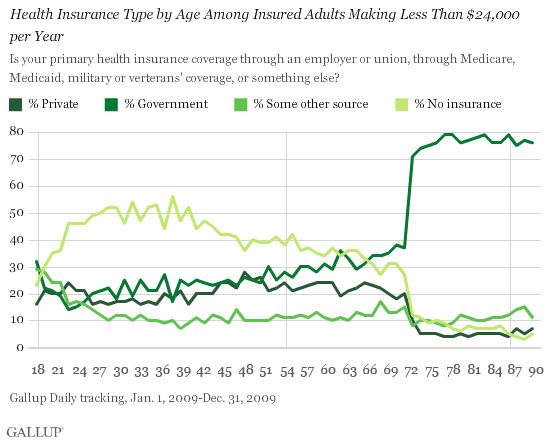
More than half of low-income Americans at several points between ages 27 and 37 do not have health insurance. That percentage begins to drop as low-income Americans reach their 40s. But even into their late 50s, more than a third of these low-income Americans report having no health insurance.
The percentage of this group who have employer-paid insurance remains low throughout their life span, reaching a high of 28% at age 44. At most ages, particularly in their 50s, low-income Americans are more likely to rely on government insurance than private insurance. After age 65, as Medicare kicks in, the percentage with government insurance jumps to about 80%.
Americans Making $24,000 to Less Than $48,000 a Year
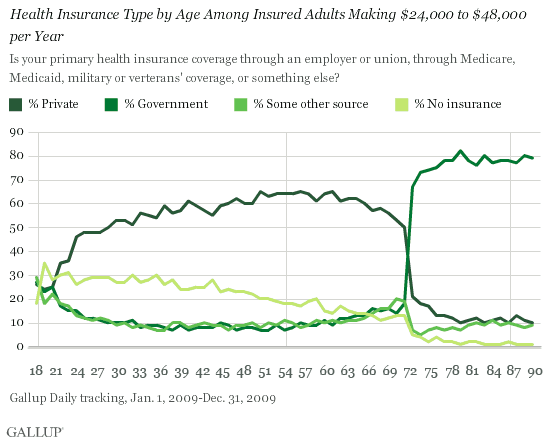
The pattern of health insurance coverage among Americans making between $24,000 and $48,000 a year is quite different than those with lower incomes. The percentage with no insurance reaches a peak in their 20s and early 30s (at about 30%), and then gradually declines as the percentage with employer-paid health insurance begins to rise. Relatively few of the Americans in this income range rely on Medicare, Medicaid, or military insurance before age 65.
Americans Making $48,000 a Year or More
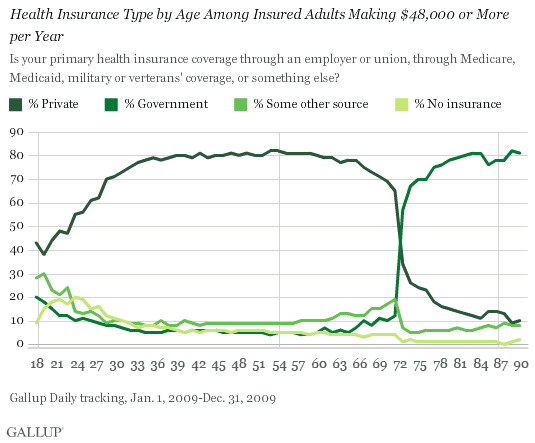
Americans making $48,000 a year or more are highly likely to have private insurance throughout most of the usual working years, with 80% or more reporting having employer or union paid insurance in their 30s, 40s, and 50s. There is relatively little reliance on government insurance until age 65, when this group becomes eligible for Medicare.
Implications
These data underscore the significant degree of variability in health insurance coverage across the American population landscape. About 16% of all Americans did not have health insurance when Gallup interviewed them in 2009. But the percentage without insurance is more than 50% among certain groups of Americans who are in their 30s and who have lower incomes, and drops close to 0% among older Americans who have higher incomes.
The age differences in coverage, which occur even among those with higher incomes, suggest that some of the explanation for a lack of coverage is a voluntary decision to do without. At the same time, the basic data on income differences in coverage reinforce the explanation that the lack of insurance coverage to a significant degree reflects economic circumstances, including lack of access to employer-paid insurance.
Learn more about the Gallup-Healthways Well-Being Index.
Survey Methods
Results are based on telephone interviews with more than 353,849 national adults, aged 18 and older, conducted Jan. 1-Dec. 31, 2009, as part of the Gallup-Healthways Well-Being Index. For results based on the total sample of national adults, one can say with 95% confidence that the maximum margin of sampling error is ±0.2 percentage points.
Interviews are conducted with respondents on landline telephones (for respondents with a landline telephone) and cellular phones (for respondents who are cell phone only).
In addition to sampling error, question wording and practical difficulties in conducting surveys can introduce error or bias into the findings of public opinion polls.
About the Gallup-Healthways Well-Being Index™
The Gallup-Healthways Well-Being Index measures the daily pulse of U.S. wellbeing and provides best-in-class solutions for a healthier world. To learn more, please visit well-beingindex.com.
